Finding safe paths through suburbia

Also published on Resilience

The post-WWII suburban settlement pattern assumes and reinforces car travel as the default transport choice for its residents. Do such settlements have a future when the temporary energy bonanza of the past 100 years falters? And can residents of suburbia begin to create that future today?

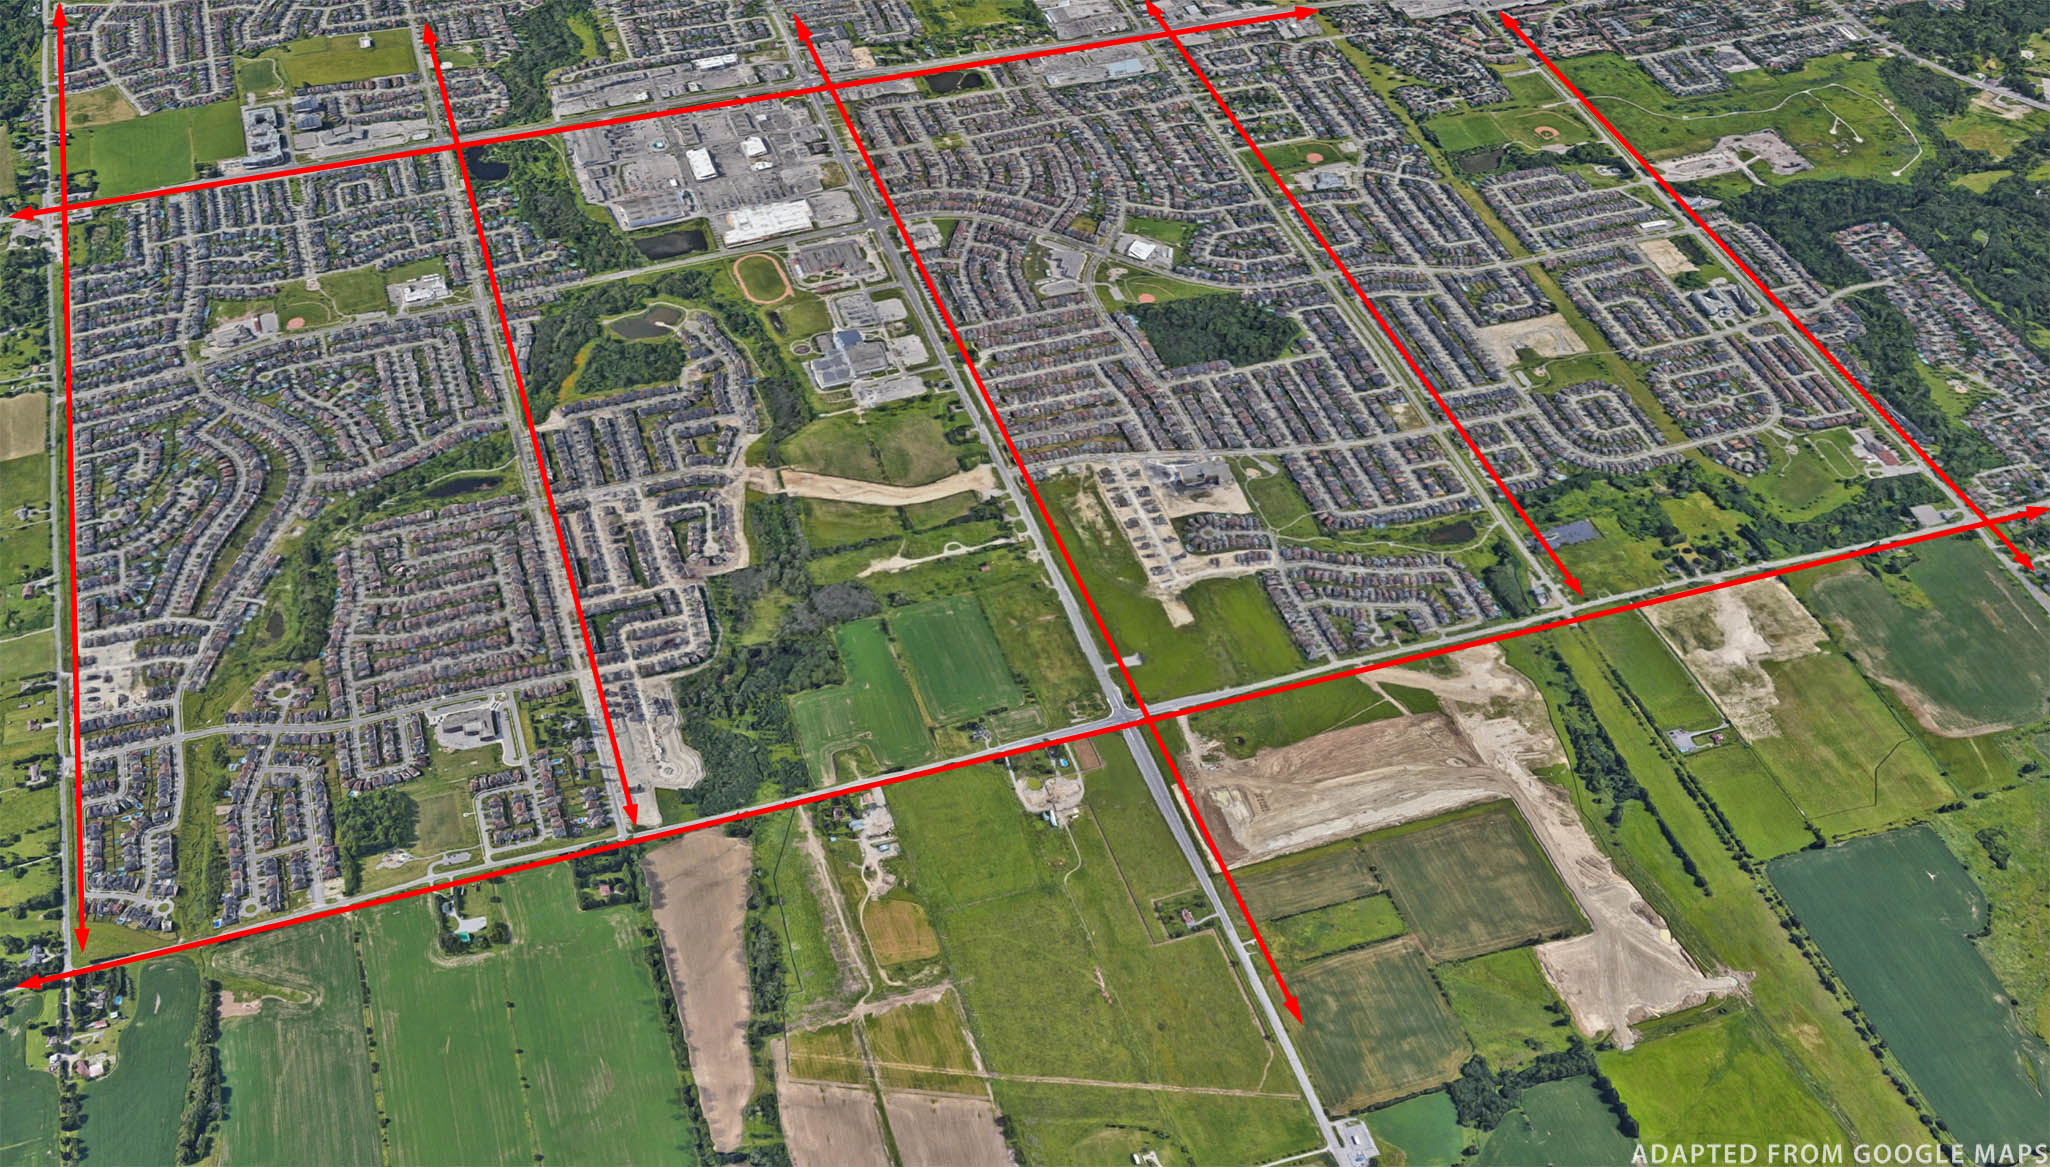
This series on the transition from car-dependency to walkability has examined the integral, sometimes convoluted relationship between land use planning and transportation planning. We’ve looked at major, top-down initiatives as well as small-scale efforts to intensify suburban land uses. This post will look primarily at small scale, from-the-ground-up efforts to make suburban travel safer for people who want to make more trips on foot or on bike.

The problems of suburbia arise not only at a local level, but are also due to national laws and subsidies that favour car ownership, state and provincial funding and specifications for expressways and major arterial roads, a housing development industry whose bread and butter is clearing land on the urban fringe for cookie-cutter subdivisions, and an entrenched culture within municipal governments that prioritizes throughput of vehicles in transportation plans.

Changes are needed at all of those levels – and some of those changes will take a lot of time, money, and political will. At a local level, though, political will can implement some important changes in very little time and with modest expenditures.

The Strong Towns organization promotes an approach that de-emphasizes large, comprehensive, expensive projects that will take years to produce results. By contrast, they advocate a simple, bottom-up approach to making small changes, starting right away:

“1. Humbly observe where people in the community struggle.

2. Ask the question: What is the next smallest thing we can do right now to address that struggle?

3. Do that thing. Do it right now.

4. Repeat.”1

Some of the barriers to walkability are small and can be quickly fixed – but in some cases they are left unfixed for years because “we are doing a transportation masterplan” which will, hopefully, propose a solution to be implemented years from now. A good example would be installing curb cuts that could make crossings accessible to someone pushing a stroller or traveling in a wheelchair. Simple improvements like this, when repeated at dozens of locations, can make life easier for many citizens and build hope and confidence that a municipality is moving in the right direction – even if larger and more elaborate changes are also needed.

A related approach, known as “tactical urbanism”, has been popularized by Mike Lydon and put into practice in many cities. (For an excellent introduction to Lydon’s approach see the video Tactical Urbanism: Transform your City Today! hosted by Gil Penalosa of 8/80 Cities.) Tactical Urbanism also looks for projects that can be implemented quickly and cheaply, though they might fit into a grand vision for much larger change to follow. By implementing changes quickly, on a pilot-project basis, this approach also allows much more effective public consultation.

As Lydon explains, typical public consultation processes fail to reach many of the people most affected by projects. The advantage of rapidly implemented pilot projects is that they allow public consultation to happen outdoors, onsite, where the people most affected by a change can see how the change is affecting their daily lives.

An example would be a “road diet”, in which a section of a four-lane collector road is reduced to three lanes – one travel lane in each direction, plus a shared center lane for left turns – thus freeing enough space for a protected bike lane on each side. Another example would be installing a “bump-out” at an intersection to reduce the unprotected distance a pedestrian needs to cross. These pilot projects can typically be done with nothing more expensive than paint and flexible, temporary plastic bollards. Following onsite consultations during the pilot project, the plan can be scrapped, modified, or implemented on a more durable permanent basis – all in less time than a comprehensive masterplan process would need to get to a draft stage.

Regular but temporary “open streets” programs – that is, closing streets to cars so they are open to people – have helped millions of people envision and understand how they could experience their cities in safer, more enjoyable, more pro-social ways. The most famous of these experiments began decades ago in Bogotá, Colombia. Today Bogotá’s program includes more than 100 km of city streets which are opened every Sunday, to a vast range of activities including exercise classes, street theatre, children’s games. The Open Streets program has spread to scores of cities, including many in North America, and has often led to permanent establishment of pedestrian blocks.2

“We’ll work with anyone – but we won’t wait for anyone”

Tactical urbanism programs often get their impetus from small groups of residents proposing changes to city staff. In some cases, though, tactical urbanist improvements are made directly by citizens who have tired of waiting for the slow wheels of bureaucracy to turn. This was the subject of a fascinating webinar entitled “Direct Action Gets the Goods: The Rise of Illicit Tactical Urbanism.”3 Led by Jessie Singer, author of There Are No Accidents, the webinar heard from anonymous direct action activists in Los Angeles, San Francisco, and Chattanooga. Their activities have included painting city-standard crosswalks at locations suggested by community members through a website form; installing benches at bus stops that lacked any nod to user comforts; and installing temporary bollards to convert a dangerous right-turn lane into a traffic-calming bump-out.

As the panelists explained, sometimes the citizen-installed crosswalks or benches were quickly removed by city staff. Just as often, however, city staff received so many messages of support for the new improvements that they were left in place, or quickly upgraded to a higher standard. In either case, the publicity the groups receive on social media ensures that important issues get a boost in visibility. Although advocacy work is sometimes seen as a win-or-lose game, a Crosswalks Collective Los Angeles member explained, “with guerrilla urbanism, there is no such thing as losing.”

“Where the sidewalk ends”, North St. Louis, photo by Paul Sableman, May 9, 2012, licensed via CC BY 2.0 DEED, accessed on Flickr.

Follow the footsteps

When city staff take a close look at what citizens are accomplishing or attempting to accomplish on their own, they may discover ways their suburban environments can be improved. In an article entitled “Walking to the Strip Mall,” Nico Larco notes that informal pedestrian routes are common around suburban strip malls, indicating that even without good infrastructure, significant numbers of people walk to these malls. He notes that:

“Pedestrian networks in suburbia are much more than just sidewalks along streets. They include sidewalks within private property, cut-throughs, the streets themselves, paved and unpaved bike paths, informal goat paths, makeshift gates in fences, and kickdowns.”4

While these routes make it easier for some residents to get to and from these malls, they are far from ideal. The routes may be muddy, rough, impassable for people pushing strollers, strewn with garbage, routed through ditches, vacant lots, woods, and may be unlit at night. They often also lead to the rear loading-dock area of a strip mall, rather than the parking lot side where store entrances are located.

However, city staff should be looking at each case to see whether it is feasible to formalize some of these informal routes to make them useful and safe for a greater number of nearby residents. For example, it may be possible to secure an easement on a strip of private land, so that an informal pedestrian route can be formalized, paved or otherwise maintained, and lighted. Perhaps a public access doorway can be installed at the rear of a building, providing straight-through access for pedestrians who would benefit from a formalized pathway from their homes to the commercial entrances of the mall.

Clearly, each case will be different and not all of the informal pedestrian paths are likely to be good candidates for upgrading. But if they don’t take seriously the “votes” of citizens who are already marking out paths with their steps, municipal officials will miss an important chance to learn and to improve their suburban environments.

Walkable, bikeable, or both?

Jeff Speck has written,

“Walkable cities are also bikeable cities, because bicycles thrive in environments that support pedestrians and also because bikeability makes driving less necessary.”5

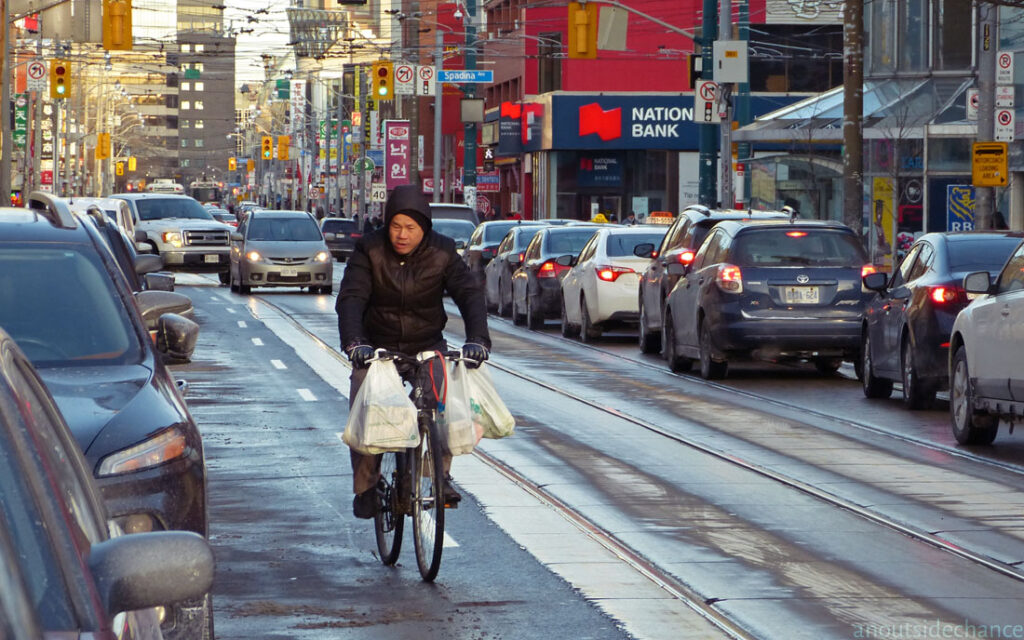
Once supportive and safe infrastructure is provided, rates of walking and biking go up dramatically. But biking is likely to be even more significant in suburban contexts, simply because distances tend to be greater. For the foreseeable future, many suburban trips are likely to be too long for walking to be a practical option – but the range of bicycles is growing due to electrification.

With the widespread availability of electric-assist bikes, a big share of suburban trips are now fully within the range of adults of average fitness. E-bikes can be a convenient, healthy, and economical transportation choice for individuals. Several US states and cities are now providing subsidies to residents for purchases of e-bikes.6

A study of e-bike potential noted that in England, an average person could comfortably use a bike for a trip of 11 km (6.8 miles), while the same average person could go 20 km (12.4 miles) on an electric-assist bike.7 One conclusion is that e-bikes could reduce car use even more in rural and suburban areas, where transit services are poor and distances are longer, than in urban cores where there are many options for the mostly short trips.

According to the United States Office of Energy Efficiency & Renewable Energy, in 2021 just over 50% of all trips were three miles or less.8

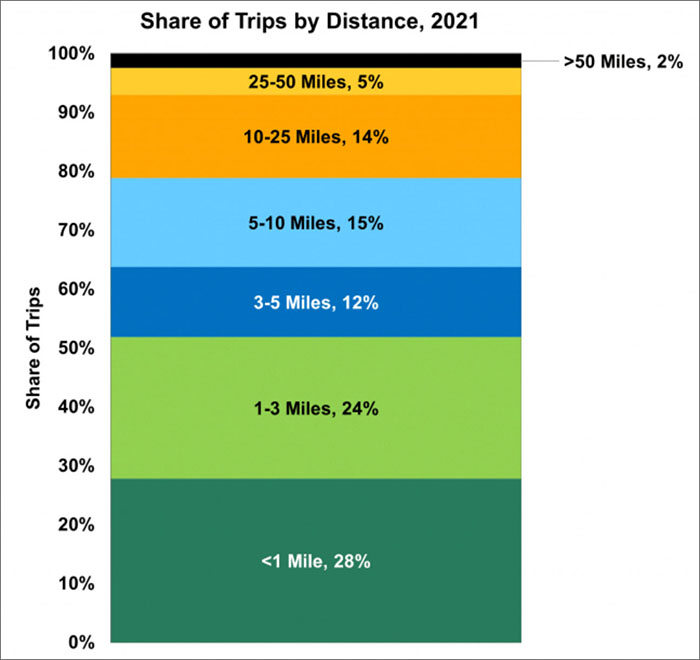
Source: Estimated for the Bureau of Transportation Statistics by the Maryland Transportation Institute and Center for Advanced Transportation Technology Laboratory at the University of Maryland. The travel statistics are produced from an anonymized national panel of mobile device data from multiple sources.

If the average resident of the US or Canada is as physically capable as the average resident of England, then even the trips in the third and fourth categories on the chart above would be feasible for many people on e-assist bikes. That would make bikes and e-bikes practical options for about 80% of trips – as long as there is safe infrastructure on which to ride those e-bikes.

The benefits of a switch by a significant segment of the population to e-bikes for many of their daily journeys would include not only a substantial reduction in traffic, but also a reduction in CO2 emissions, better health for the people making that lifestyle change, and significant cost reductions both for individuals and for cities.

Citing AAA figures, Michael Thomas wrote this month that

“After fuel, maintenance, insurance, taxes, and the like, owning and driving a new car in America costs $10,728 a year. My e-bike, by comparison, cost $2,000 off the rack and has near-negligible recurring charges.”

If a typical two-car family can trade one of their cars for an e-bike, that can make suburban housing suddenly much more affordable. But even the cost savings aren’t “the real reason you should get an e-bike,” Thomas wrote, because

“Study after study shows that people with longer car commutes are more likely to experience poor health outcomes and lower personal well-being—and that cyclists are the happiest commuters.”9

Should your municipality consider offering subsidies to encourage e-bike use? Consider that a $400 (US) subsidy could cover from 20% to 40% of the cost of a good e-bike, while that amount would be too small to be relevant to the potential buyer of an electric car. Consider also that e-bike charging stations could be installed at libraries, schools, shopping malls, and other destinations at a small fraction of the cost of electric car chargers, with little or no need to install electric grid upgrades.

* * *

There are a host of complications in transforming car-dependent suburbs. When I started this series on car-dependent suburbs, I planned to finish with one post on making the transformation to walkable, bikeable communities. That concluding post has now stretched to three long posts and I’ve just scratched the surface.

Clearly the best option would be to stop digging ourselves into these holes: stop building car-dependent suburbs now. But if you’re already in a car-dependent suburb, the time to start the transition to a walkable community is also now.


Notes

1 In “The Strong Towns Approach to Public Investment,” by Charles Marohn, Strong Towns, Sept 23, 2019.

2 See The Open Streets Project for information on these programs.

3 Part of the Vision Zero Cities 2023 conference sponsored by Transportation Alternatives, Oct 18, 2023.

4 “Walking to the Strip Mall: Retrofitting Informal Pedestrian Paths,” by Nico Larco, in Retrofitting Sprawl: Addressing Seventy Years of Failed Urban Form, edited by Emily Talen, University of Georgia Press, 2015.

Walkable City, 10th Anniversary Edition, by Jeff Speck, Picador, 2022, page 72.

Free electric bikes? How many US cities and states are handling e-bike subsidies,” electric.co, 19 Feb 2023.

E-bikes and their capability to reduce car CO2 emissions,” by Ian Philips, Jillian Anable and Tim Chatterton, Transport Policy, February 2022.

More than Half of all Daily Trips Were Less than Three Miles in 2021,” US Office of Energy Efficiency & Renewable Energy, March 21, 2022.

The real reason you should get an e-bike,” by Michael Thomas, The Atlantic, 20 Oct 2023.


Photo at top of page: “A man walks south on Cobb Parkway just south of Southern Polytechnic State University and Life University, a stretch of US 41 lacking sidewalks almost entirely. He’s got a long walk ahead to find the next crosswalk, which is 0.9 miles from the last one at Highway 120 — a stretch that is also almost completely devoid of sidewalks on both sides of the street.” Photo by Transportation For America, Metro Atlanta Pedestrians series, on Flickr, taken March 30, 2012, licensed via CC 2 BY-NC-ND 2.0 DEED.

Turning a new leaf in suburbia

Also published on Resilience

Social critic James Howard Kunstler referred to suburban sprawl as “the greatest misallocation of resources in history.”1 In his view, “The suburbs have three destinies – as slums, salvage yards, and ruins.”2

While agreeing that suburbs in their current form are “hopelessly maladapted to the coming world of energy descent,” permaculture pioneer David Holmgren nevertheless believes that “Low-density detached housing with gardens is the ideal place for beginning a bottom-up revolution to recreate the household and community non-monetary economies that our recent forebears took for granted as the basis for an adequate, even comfortable, life.”3

Suburbs have not come to an end – I’m my region, in fact, they are still adding suburban sprawl like there’s no tomorrow. Signs of positive transformations of suburban developments exist across North America, but you might need to look carefully to notice.

This post will look at some of those signs of transformation and how they might be accelerated. In contrast to the last post, Can car-dependent suburbs become walkable communities?, this post and the next will focus mostly on small-scale initiatives.

The major theme of this series of posts has been the contrast between car-dependency and walkable communities. Walkability is a transportation issue, of course, but it is more than that.

It is often said that transportation planning and land use planning are two sides of the same coin.4 It’s important to look at both issues, not only as they are addressed in government policies, but also as they are addressed by individuals or small groups of neighbours.

For the purposes of this discussion, three key features of suburbia are:

  1. zoning rules that mandate the separation of residential districts from commercial districts and industrial districts;
  2. the default assumption that people will drive cars from their homes to workplaces, stores, cultural events, and recreational facilities; and
  3. the organization of the resulting car traffic into maze-like local residential streets, larger collector streets, six-to-eight lane major arterials, and expressways.

These basic parameters have many implications as discussed in previous posts. The practice of driving everywhere means there also needs to be parking at every location, so that a typical suburban district has several parking spaces for every car. (See How parking ate North American cities.)

The funneling of traffic to bigger but more widely spaced roads leads to traffic jams during every rush hour, and dangerous speeding when traffic volumes are low. The dangerous collector and arterial roads put vulnerable road users, such as pedestrians and cyclists, at risk of death or serious injury in getting from their own immediate neighbourhoods to other neighbourhoods. (See Building car-dependent neighbourhoods).

And the low residential and employment density of sprawl makes it difficult and expensive to build public transit systems that run frequently and within a short walk of most residents. The result is that suburban sprawl seldom has good transit, which in turn strongly reinforces car-dependency. (See Recipes for car dependency.)

Change will not be optional

Notwithstanding the difficulties of transforming the suburban pattern, I believe it will happen for this simple reason:

That which is not sustainable will not be sustained.

First, suburban sprawl is not financially sustainable, particularly in the governance arrangements we have in North America. As Strong Towns has demonstrated through numerous articles, podcasts and videos, North American suburban expansion has been a Ponzi scheme. While expansion infrastructure is usually paid for through a combination of federal government and developer funding, local municipalities are left with the liabilities for infrastructure maintenance and eventual replacement. That wouldn’t be a problem if the new districts could raise sufficient property tax revenue to cover these liabilities. But they don’t.

Low-density housing tracts, interspersed with one-story shopping centers and strip malls, all surrounded by expansive parking, don’t bring in nearly as much property tax/acre as denser, multi-story developments in older downtown districts do. The low tax revenue, coupled with very high maintenance-replacement liabilities for extensive roadways, parking lots, and utilities, eventually catch up with municipalities. And then? Some can keep the game going, simply by getting more funding grants for even further sprawl – thus the “Ponzi scheme” moniker – but eventually they run out of room to expand.

As Charles Marohn has written, “Decades into this experiment, American cities have a ticking time bomb of unfunded liability for infrastructure maintenance. The American Society of Civil Engineers (ASCE) estimates deferred maintenance at multiple trillions of dollars, but that’s just for major infrastructure, not the local streets, curbs, walks, and pipes that directly serve our homes.”5

Worth noting is that as climate instability forces infrastructure reconstructions to happen more frequently and to higher standards, the pressure on municipal governments will be even more intense. And as energy costs spike higher, fewer residents will be able to afford the long commutes in private cars that they now take for granted.

When suburban municipalities face bankruptcy, what will the choices be? Certainly one choice is to abandon some areas to become, in Kunster’s words “slums, salvage yards, and ruins.” For reasons explained below, I think it’s more likely that municipalities will allow more varied and denser developments than are currently permitted by zoning codes, so that a larger property tax base can help cover infrastructure liabilities.

Suburban sprawl is also likely to prove unsustainable at the level of individual homes. Debt has grown rapidly in recent decades, and a great deal of that debt is in the form of mortgages by homeowners – many of whom live in the far reaches of suburbia.

Jeff Speck wrote “The typical American working family now lives in suburbia, where the practice of drive-’til-you-qualify reigns supreme.”6 Due to a dearth of affordable homes inside American cities (and in Canadian cities as well), new home buyers have only been able to qualify for mortgages far from urban cores. The price for somewhat cheaper housing, however, is that each working member of the family is likely to need a car to get to and from work. In Speck’s words,

“The average American family now spends about $14,000 per year driving multiple cars. … Remarkably, the typical ‘working’ family, with an income of $20,000 to $50,000, pays more for transportation than for housing.”7

When families are paying for the biggest mortgage they qualify for plus the cost of keeping two or more cars on the road, the shock of higher interest rates, a rise in unemployment, and/or higher gas costs can be too much to sustain. Referring to the 2007-2009 oil price spike and economic downturn, Speck explains that “as gasoline broke $4.00 per gallon and the housing bubble burst, the epicenter of foreclosures occurred at the urban periphery.”8

In coming economic crises, on a collective scale or an individual scale, I wouldn’t expect the suburbs to be abandoned or to be torn down en masse and rebuilt. Frankly, I don’t expect society to be wealthy enough to simple start over in other places or following other patterns. Instead, I would expect both municipal governments and individuals to muddle through by making a wide range of adjustments. And some of those are starting already.

The household as a place of production, just consumption

As Samuel Alexander and Brendan Gleeson have written, “Built environment change is slow and contested. In a developed city, turnover (additions and alterations) in the built stock is typically much less than five per cent per annum.”9 But while buildings, lots and streets may change slowly, the activities that go on there may change more rapidly.

One significant change has been happening already, in spite of zoning rules that typically disallow the change.

In a post titled “Your Home Office Might Be Illegal,” Edward Erfurt wrote,

“The frontline zoning battle for the right to work out of your home hit center stage during COVID. Under most zoning codes, we are all breaking the law.”10

He adds that “Working from home and working out of a home has become normalized. … Others have even taken the next incremental step of leaving a corporate job to open a new business in our homes.”

Simply turning a blind eye to zoning violations is one thing, but Erfurt urges municipalities to take a proactive approach:

“Home Occupations should be permitted by right in every zoning category in your community. Whether you are working remotely for a large corporation or running your own business, you should have the right to do this within your home. Cities should encourage home occupations as a tenet of their economic development strategy, and a single line could be added to any code to focus the planners.”

Robert Rice describes how the dynamic is now playing out in Houston:

“This is how the Suburban Experiment really ends: not with explosive legislation, but with regular people making the best of what they have. In Houston, what we have is houses. I propose that these new house-businesses, home offices, and de-facto multifamily residences are the first increment of intensity for a suburban neighborhood.”11

Some of these changes are taking place in accord with current law and some in defiance of current law. However, many jurisdictions across North America are now changing rules to allow modestly greater density in residential areas, including in suburbs. Travis Beck recently wrote:

“Minneapolis, for example, ended single-family zoning effective January 2020, allowing the construction of duplexes and triplexes on all residential lots. Oregon passed legislation in 2019 requiring cities with populations above 25,000 to allow construction of duplexes, triplexes, and fourplexes on all residential lots. And California’s 2021 Senate Bill 9 allows the construction of duplexes on residential lots and the splitting of sufficiently large lots into two parcels, effectively allowing four housing units to be built in place of one.”12

Even the province of Ontario, infamous for bungled attempts to enrich land speculators by fast-tracking sprawl on previously protected lands, recent legislation specifies that “up to three residential units are permitted ‘as of right’ on most land zoned for one home in residential areas without needing a municipal by-law amendment.”13

Intermittent additions of one or two residences per lot may seem insignificant compared with the scope of the housing crisis; such zoning changes are certainly not sufficient to make suburbia sustainable. Yet such changes provide for greater flexibility in housing options and promote actions by individual property owners and small contractors, in contrast to the large developers who are often spoken of as the only actors who can solve the housing crisis. Paradoxically, the pace of densification on a lot-by-lot basis could pick up in an economic downturn, if significant numbers of homeowners decide it make sense to downsize their overly-large residences by creating one or two rental units.

It’s not only the number of residential units and the number of residences that matter, but also the kinds of activities that happen in residential neighbourhoods. As discussed above, a large number of suburban homes are now de facto workplaces. The work done in and around homes, whether or not that work is counted in official economic statistics, could become a greater factor in the suburban economy.

The Victory Garden movements of the last century encouraged people to raise food in their own yards, whether they lived in cities, the nascent suburbs, small towns or rural areas. In the US, during WW I about one-third of US vegetables came from Victory Gardens. By 1943 during WW II, there were 12 million Victory Gardens in cities. A Wikipedia article notes that “While Victory Gardens were portrayed as a patriotic duty, 54% of Americans polled said they grew gardens for economic reasons while only 20% mentioned patriotism.” (Image on left is a WWI-era poster from Canada; at right is WWII image from use. Images and data from Wikipedia article Victory garden.)

One of the key features of most suburbs, visible from the street or from the air, is the small- or medium-size plot of lawn adjacent to each single-family dwelling. But the biological desert of the standard lawn can easily be replaced with something much more life-giving. Alexander and Gleeson write:

“Digging up backyards and front yards and planting fruit and vegetables, keeping chickens, and composting, are important practices, reconnecting people with the seasons, the soil, and the food on their plates. In the words of permaculture activist and educator, Adam Grubb, we should ‘eat the suburbs’.”14

A frequent objection to this idea is that few people could raise all their own food on a typical suburban lot. Quite true, and quite beside the point. More relevant is that many and perhaps most suburban residents could raise a significant portion of their fruits, vegetables, herbs, eggs, and other foods if they choose. In the process, they and their communities would become more resilient while promoting greater local biodiversity.

Suburban landscapes often include many other strips of green, kept semi-alive through regular mowing and sometimes watering: strips between areas of parking lots, in front of strip malls, on medians within major arterials, within the “cloverleafs” of expressway interchanges. Alexander and Gleeson invite us to imagine the transformation of these areas:

“Over time, we can imagine food production crossing beyond household boundaries, too, re-commoning public space. This is already under way, as people reclaim nature strips for food production, plant fruit trees in the neighborhood, establish community gardens, and cultivate unused land through “guerrilla gardening.’”15

Alexander and Gleeson write in an Australian context. In North America, a great example of similar change is the work of permaculture proponent Jan Spencer in Eugene, Oregon. Over the past twenty-three years he has transformed his quarter-acre suburban lot into an oasis. Starting with an 1,100 square foot home fronted by a driveway big enough to park six cars, Spencer gradually turned the driveway and surrounding spaces into three-dimensional gardens, added enough water tanks to collect thousands of gallons of rainwater to keep his gardens happy through the typically dry local summer, and built a 400 square foot living space for himself so he could rent out three rooms in the house.16

As Spencer explains, a key permaculture principle is to design each change so that it meets multiple purposes. With his changes he has, among other things, increased the residential density of his property, provided an income for himself, taken major steps toward food security, added carbon storage, buffered the effects of extreme heat, drought, and rainfall, and reduced the draw on city utilities such as the water system.

Such activities hold the potential of turning the suburban household “into a place of production, not merely consumption.”17

Trip generation

What do home offices and front-yard gardens have to do with transportation? Recall the incantation of traffic engineers: “trip generation.”

A home with, for example, two adult residents “generates” fewer trips when one of those adults can work at home most days instead of commuting. The home will generate fewer trips to buy groceries if the household grows a lot of their own vegetables in the summer, and perhaps puts up some of those vegetables for the winter too.

A family with two or three cars for each working member may find they can trade one of those cars for a bike, taking the bike on grocery runs much of the time. Each family which reduces the number of cars they own not only reduces traffic, but also reduces the number of parking spaces needed both in their immediate neighbourhood and at the stores, schools or workplaces they can reach without driving. Which, in turn, makes it more feasible to gradually increase the number of residences in a neighbourhood or the number of stores in a shopping plaza, as the need to devote precious space to parking is reduced.

Obviously, not every suburban resident can make these type of lifestyle changes at present. Just as obviously, we don’t need all, or even most, suburban residents to become car-free before we see a major impact on traffic patterns and usage of public transit. Finally and obviously, only a limited number of people will willingly bike or walk outside of their immediate neighbourhoods until we make the roads safe for them, and few people will willingly switch to public transit if the service is slow, infrequent, or unreliable.

So zoning and land use changes, while necessary, are not sufficient to transform car-dependent suburbia into sustainable, walkable communities. Many changes to transportation policy and infrastructure are also needed. Some of these will require governments to play a major role, but many can be initiated by small groups of neighbours who see immediate problems and advocate or demonstrate simple solutions. Those changes will be the subject of the next post in this series.


Notes

1 TED talk transcript, April 20, 2007.

2 Quoted by Leigh Gallagher in The End of the Suburbs, Penguin Books, 2013; page 206. As an aside, it was in Gallagher’s book that I first learned of the Strong Towns movement; I have been learning from their blog posts, books, podcasts and videos ever since.

3 Foreword to Degrowth in the Suburbs, by Samuel Alexander and Brendan Gleeson, Palgrave Macmillan, 2019; page vii.

E.g., see Land Use Impacts on Transport: How Land Use Factors Affect Travel Behavior, by Todd Litman, Victoria Transport Policy Institute, Victoria, BC. Page 3.

“America’s Growth Ponzi Scheme,” Strong Towns, May 18, 2020.

Walkable City, 10th Anniversary Edition, by Jeff Speck, Picador, 2022; page 30.

7 Walkable City, page 30.

8 Walkable City, page 30.

9 Degrowth in the Suburbs, page 12.

10 Edward Erfurt, “Your Home Office Might Be Illegal”, on Strong Towns blog, Oct 13, 2023.

11 Robert Rice, “The End of Suburbia Starts with Disobedience,” on Strong Towns blog, Oct 13, 2023. Rice explains both the differences and similarities between the deed restrictions that are common in Houston, and the zoning-based restrictions much more common in most American cities.

12 In “ADUs Can Help Address The Lack Of Housing. But They’re Bad Urban Design.” by Travis Beck, Next City, Oct 5, 2023.

13 From “Backgrounder: More Homes Built Faster Act, 2022”, Ontario Government Newsroom, November 28, 2022.

14 Degrowth in the Suburbs, page 133.

15 From “Suburban Practices of Energy Descent,” by Samuel Alexander and Brendan Gleeson, Energy Transition and Economic Sufficiency, Kreps & Cobb, editors, Post Carbon Institute, 2021; page 189.

16 See Spencer’s description of this project in “Transforming suburbia,” on Resilience.org, October 6, 2023, and a video tour of Spencer’s property conducted by Laura Sweeny of Raintree Nursery.

17 “Suburban Practices of Energy Descent,” page 190.


Image at top of page: Levittown, PA, circa 1959, adapted from public domain image at Wikimedia Commons.

Reckoning with ‘the battering ram of the Anthropocene’

Also posted on Resilience

Is the word right on the tip of your tongue? You know, the word that sums up the ecological effects of more, faster and bigger vehicles, driving along more and wider lanes of roadway, throughout your region and all over the world?

If the word “traffication” comes readily to mind, then you are likely familiar with the work of British scientist Paul Donald. After decades spent studying the decline of many animal species, he realized he – and we – need a simple term summarizing the manifold ways that road traffic impacts natural systems. So he invented the word which serves as the title of his important new book Traffication: How Cars Destroy Nature and What We Can Do About It.

The field of study now known as road ecology got its start in 1925, when Lillian and Dayton Stoner decided to count and categorize the road kill they observed on an auto trip in the US Midwest. The science of road ecology has grown dramatically, especially in the last 30 years. Many road ecologists today recognize that road kill is not the only, and likely not even the most damaging, effect of the steady increase in traffication.

Noise pollution, air and water pollution, and light pollution from cars have now been documented to cause widespread health problems for amphibians, fish, mammals and birds. These effects of traffication spread out far beyond the actual roadways, though the size of “road effect zones” vary widely depending on the species being studied.

Donald is based in the United Kingdom, but he notes there are relatively few studies in road ecology in the UK; far more studies have been done in the US, Canada, and Western Europe. In summarizing this research Donald makes it clear that insights gained from road ecology should get much more attention from conservation biologists, transport planners, and those writing and responding to environmental impact assessments.

While in no way minimizing the impacts of other threats to biodiversity – agricultural intensification and climate change, to name two – the evidence for traffication as a major threat is just as extensive, Donald writes. He cites an apt metaphor coined by author Bryan Appleyard: the car is “the Anthropocene’s battering ram”.

Traffication has important implications for every country under the spell of the automobile – and particular relevance to a controversy in my own region of Ontario, Canada.

A slow but relentless increase

One reason traffication has been understudied, Donald speculates, is that it has crept up on us.

“These increases have been so gradual, a rise in traffic volume of 1 or 2 per cent each year, that most of us have barely noticed them, but the cumulative effect across a human lifetime has been profound.” … (All quotes in this article from the digital version of Traffication.)

“Since the launch of the first Space Shuttle and the introduction of the mobile phone in the early 1980s,” Donald adds, “the volume of traffic on our roads has more than doubled.”

Though on a national or global scale the increase in traffic has been gradual, in some localities traffication, with all its ill effects, can suddenly accelerate.

That will be the case if the government of Ontario follows through with its plan to rapidly urbanize a rural area on the eastern flank of the new Rouge National Urban Park (RNUP), which in turn is on the eastern flank of Toronto.

The area now slated for housing tracts was, until last November, protected by Greenbelt legislation as farmland, wetland and woodland. That suddenly changed when Premier Doug Ford announced the land is to be the site of 30,000 new houses in new car-dependent suburbs.1 And barring a miracle, the new housing tracts will be car-dependent since the land is distant from employment areas and services, distant from major public transit, and because the Provincial government places far more priority on building new highways than building new transit.

Though the government has made vague promises to protect woodlands and wetlands dotted between the housing tracts, these tiny “nature preserves” would be hemmed in on all sides by new, or newly busy, roads.

As I read through Donald’s catalog of the harms caused by traffication, I thought of the ecological damage that will be caused if traffic suddenly increases exponentially in this area that is home to dozens of threatened species. The same effects are already happening in countless heavily trafficated locales around the world.

“A shattered soundscape”

Donald summarizes the wide array of health problems documented in people who live with constant traffic noise. The effects on animals are no less wide-ranging:

“A huge amount of research, from both the field and the laboratory, has shown that animals exposed to vehicle noise suffer higher stress levels and weakened immune systems, leading to disrupted sleep patterns and a drop in cognitive performance.”

Among birds, he write, “even low levels of traffic noise results in a drop in the number of eggs laid and the health of the chicks that hatch.” As a result, “Birds raised in the presence of traffic noise are prematurely aged, and their future lifespans already curtailed, before they have even left the nest.”

Disruptions in the natural soundscape are particularly stress-inducing to prey species (and most species, even predators, are at risk of being someone else’s prey), since they have difficulty hearing the alarm signals sent out by members of their own and other species. To compensate, Donald writes, “animals living near roads become more vigilant, spending more of their time looking around for danger and consequently having less time to feed.”

A few species are tolerant of high noise levels, and seldom become road kill; their numbers tend to go up as a result of traffication. Many more species are bothered by the noise, even at a distance of several hundred meters from a busy road. That means their good habitat continues to shrink and and their numbers continue to drop. Donald writes that half of the area of the United Kingdom, and three-quarters of the area of England, is within 500 meters of a road, and therefore within the zone where noise pollution drives away or sickens many species.

Six-hundred thousand islands

When coming up to a roadway, Donald explains, some animals pay no attention at all, others pause and then dash across, while others seldom or never cross the road. As the road gets wider, or as the traffic gets faster and louder, more and more species become road avoiders.

While the road avoiders do not end up as roadkill, the road’s effect on the long-term prospects of their species is still negative.

When animals – be they insects, amphibians, mammals or birds – refuse to cross the roads that surround their territories, they are effectively marooned on islands. Taking account of major roads only, the land area of the globe is now divided into 600,000 such islands, Donald writes.

Populations confined to small islands gradually become less genetically diverse, which makes them less resilient to diseases, stresses and catastrophes. Local floods, fires, droughts, or heat waves might wipe out a species within such an island – and the population is not likely to be replenished from another island if the barriers (roadways) are too wide or too busy.

The onset of climate change adds another dimension to the harm:

“For a species to keep up as its climate bubble moves across the landscape , it needs to be able to spread into new areas as they become favourable . … In an era of rapid climate change, wildlife needs landscapes to be permeable, allowing each species to adapt to changing conditions in the optimal way. For many species, and particularly for road-avoiders, our dense network of tarmac [paved road] blockades will prove to be a significant problem.”

Escaping traffication

Is traffication a one-way road, destined to get steadily worse each year?

There are solutions, Donald writes, though they require significant changes from society. He makes clear that electrification of the auto fleet is not one of those solutions. It’s obvious that electric cars will not reduce the numbers of animals sacrificed as road kill. Less obvious, perhaps, is that electric cars will make little difference to the noise pollution, light pollution, and local air pollution resulting from traffication.

At speeds over about 20 mph (32 km/hr) most car noise comes from the sound of tires on pavement, so electric cars remain noisy at speed.

And due to concerted efforts to reduce the tailpipe emissions from gas-powered cars, most particulate emissions from cars are now due to tire wear and brake pad wear. Since electric cars are generally heavier, their non-tailpipe emissions tend to be worse than those from gas-powered cars.

One remedy that has been implemented with great success is the provision of wildlife bridges or tunnels across major roadways. In combination with fencing, such crossings have been found to reduce road kill by more than 80 per cent. The crossings are expensive, however, and do nothing to remedy the effects of noise, particulate pollution, and light pollution.

A partial but significant remedy can be achieved wherever there is a concerted program of auto speed reductions:

“Pretty much all the damage caused by road traffic – to the environment, to wildlife and to our health – increases exponentially with vehicle speed. The key word here is exponentially – a drop in speed of a mere 10 mph might halve some of the problems of traffication, such as road noise and particulate pollution.”

Beyond those remedies, though, the key is social reorganization that results in fewer people routinely driving cars, and then for shorter distances. Such changes will take time – but at least in some areas of global society, such changes are beginning.

Donald finds cause for cautious optimism, he says, in that “society is already drifting slowly towards de-traffication, blown by strengthening winds of concern over human health and climate change.”

There’s scant evidence of this trend in my part of Ontario right now,2 but Donald believes “We might at least be approaching the high water mark of motoring, what some writers refer to as ‘ peak car ’”. Let’s hope he’s right.


1 A scathing report by the Province’s Auditor General found that the zoning change will result in a multi-billion dollar boost to the balance sheets of large land speculators, who also happen to be friends of and donors to the Premier.

2 However, there has been a huge groundswell of protest against Premier Doug Ford’s plan to open up Greenbelt lands for car-dependent suburban sprawl, and it remains unclear if the plan will actually become reality. See Stop Sprawl Durham for more information.


Note to subscribers: the long gap between posts this summer has been due to retina surgery and ensuing complications. It’s too early to tell if I’ll be able to resume and maintain a regular posting schedule, but I do hope to complete a post on transforming car-dependent neighbourhoods as promised in May.

Building car-dependent neighbourhoods

Also published on Resilience

Car-dependent neighbourhoods arise in a multi-level framework of planning, subsidies, advertising campaigns and cultural choices. After that, car dependency requires little further encouragement. Residents are mostly “locked-in”, since possible alternatives to car transport are either dangerous, unpleasant, time-consuming, or all three.

At the same time, municipal officials have strong incentives to simply accept car dependency – it takes bold new thinking to retrofit such neighbourhoods. Voters are likely to resist such new directions, since it is hard for them to imagine making their daily rounds using anything except private cars.

This post continues a discussion of what car dependency looks like on the map. The previous installment looked at car dependency on a regional scale, while this one looks at the neighbourhood scale.

Both posts use examples from Durham Region, a large administrative district on the east flank of Toronto. With a current population of about 700,000, Durham Region is rapidly suburbanizing.

I’ve picked one neighbourhood to illustrate some common characteristics of car-dependent sprawl. I have chosen not to name the neighbourhood, since the point is not to single out any specific locale. The key features discussed below can be seen in recent suburban developments throughout Durham Region, elsewhere in Ontario, and around North America.

Let’s begin to zoom in. In the aerial view below you can see new subdivisions creeping out towards a new expressway. Brown swatches represent farmland recently stripped of topsoil as the first step in transforming rich agricultural land into suburban “development”. (In the short time since this aerial imagery was obtained, the brown swatches have become noticeably more extensive.)

The neighbourhood we’ll focus on includes a high school, conveniently identifiable by its distinctive oval running track.

Subdivisions here are built in a megablock layout, with the large-scale grid intended to handle most of the traffic. Within each megablock is a maze of winding roads and lots of dead-ends. The idea is to discourage through traffic on residential streets, but this street pattern has many additional consequences.

First, from the centre of one megablock to the centre of another nearby megablock, there is seldom a direct and convenient route. A trip that might be a quarter of a kilometer as the crow flies might be a kilometer or two as the car drives. In the worst areas, there are no available short cuts for cyclists or pedestrians either.

Second, the arterial roads need to be multilane to cope with all the traffic they collect – and as “development” proceeds around them they are soon overwhelmed. “Recovering engineer” Charles Marohn explains this phenomenon using an analogy from hydrology. At a time of heavy rain, a whole bunch of little streams feed into progressively larger streams, which soon fill to capacity. With a pattern of “collector” roads emptying into secondary arterial roads into primary arterials and then into expressways, suburban road systems manage to engineer traffic “floods” each time there is a “heavy rain” – that is, each morning and afternoon at rush hour.1

As we zoom in to our high school’s neighbourhood, note another pattern repeated throughout this region. Within a residential neighbourhood there may be a row of houses close to and facing an arterial road. Yet these houses are on the equivalent of a “service road” rather than having direct access to the arterial. For motorists living here the first stage of a journey, to the arterial road just 50 meters from their driveway, requires driving ten times that far before their journey can really begin. Though the maze pattern is intended to limit traffic in such neighborhoods, residents create a lot of traffic simply to escape the maze.

The residential service road pattern has the effect of making arterial roads into semi-controlled-access roads. As seen in this example, there are few driveways or other vehicle entry points in long straight stretches of such an arterial. This design encourages drivers to drive well above the posted 60 km/hr speed limit … whenever the road is not clogged with rush-hour traffic, that is.

High traffic speeds make crossing such roads a dangerous undertaking for pedestrians and cyclists. True, there are some widely-spaced authorized crossing points, with long waits for the “walk” light. But when getting to and waiting at a crosswalk is not convenient, some people will predictably take their chances fording the rushing stream at other points. How many parents will encourage or even allow their children to walk to school, a playground, or a friend’s house if the trip involves crossing roads like these?

Just across the road. High school is on the left of the road, residential neighbourhood to the right.

Pedestrian access is at best a secondary consideration in such developments. Consider the aerial view below.

Directly across one arterial road from the high school, and across another arterial from a residential neighbourhood, is a cluster of big box retail stores including a Walmart Supercentre. The Walmart has 200 meters of frontage on the street, but in that stretch there is no entrance, nothing but concrete wall to greet the occasional lonesome pedestrian.

From another direction, many people live “just across the street” from the Walmart and other stores. Except … would-be pedestrian shoppers will need to cross not just a multilane urban highway, but also hectares of parking lot, before reaching the doors of a store. These stores are large in retail floor area, but they are dwarfed by the land given to parking. In accord with minimum parking requirements, the stores have spent hundreds of thousands of dollars to provide “free parking”. But there is no requirement to take the convenience of pedestrians into account. The doors open to the parking lots, not to the streets, because the vast majority of shoppers will arrive in large private vehicles that will need to be stored somewhere while the owner goes shopping.

Nevertheless there will be a small minority in such neighbourhoods who get to the store on foot or on bike. A few might be brave, stubborn environmentalists or exercise freaks. But mostly they will be people who can’t afford a car, or who can’t drive because of some type or degree of disability. Disproportionately, they will be elderly and/or in poor health. Particularly when carrying heavy bags of groceries, they will not want to go far out of their way to get to a crosswalk, preferring instead to make the shortest straightest trip home. It is not an accident that high-volume arterial roads in suburbs account for a large proportion of pedestrian deaths in North American cities. It is not an accident, either, that a disproportionate number of these deaths are inflicted on elderly, disabled, poor, or racially disadvantaged pedestrians.2

Lamp posts

Out beyond the beyond

It is now widely recognized that car-dependent suburbia hurts public health via an increase in diseases of sedentary lifestyle and due to the stress of spending many hours a week in alternately frenetic and creeping traffic.3 The environmental costs of sprawl include high carbon emissions, impermeable ground covering that rapidly flushes polluted run-off into diminishing areas of creeks and wetlands, and urban heat-island effects from so much concrete and asphalt. Particularly in Ontario, new tracts of car-dependent sprawl can only be built with the sacrifice of increasingly scarce class one farmland.4 Finally, groups such as Strong Towns have documented the long-term fiscal disaster of suburban development.5 Even though higher levels of government typically pay much of the initial cost of major infrastructure, municipalities will be on the hook for maintenance and eventual rebuilding – and property taxes in low-density suburbs seldom bring in enough revenue to cover these steadily accruing liabilities.

Yet in Ontario the large property developer lobby remains as strong a political force as ever. The Premier of Ontario makes no real attempt to hide his allegiance to the largest property developers.6 In Durham Region, after a long public consultation process recommended intensification of existing urban areas to accommodate growing populations, politicians suddenly voted instead for a sprawl-expanding proposal put forward by the development industry lobby.7

So in 2023, corn fields and pastures beyond the current edge of suburbia are being bulldozed, new maze-like streets laid out, thousands of big, cheaply-made, dearly-purchased, cookie-cutter houses stuffed into small lots. For a brief period new residents can look through the construction dust and see nearby farmland or woodland – until the edge of suburbia takes the next step outward.

Suppose you believe, as I do, that this ruinous pattern of development should not and cannot last – that this pattern will not survive past the era of cheap energy, and will not survive when its long-term fiscal non-sustainability results in collapsing services and municipal bankruptcies. When car culture sputters, falters and runs off the road, can these thousands of neighbourhoods, home to millions of people, be transformed so they are no longer car dependent? That’s a big question, but the next post will offer a few ideas.

For today, the edge


Image at top of page: Bulldozertown (click here for full-screen image). All photos used here are taken in the same area shown in satellite views.


Notes

Charles Marohn, Confessions of a Recovering Engineer, Wiley, 2021; pages 85–87.

For analyses of trends in pedestrian deaths, see Angie Schmitt’s 2020 book Right of Way (reviewed here), and Jessie Singer’s 2022 book There Are No Accidents (reviewed here).

See “Suburbs increasingly view their auto-centric sprawl as a health hazard,” by Katherine Shaver, Washington Post, December 28, 2016.

“Ontario losing 319 acres of farmland every day,” Ontario Farmland Trust, July 4, 2022.

See “The Growth Ponzi Scheme: A Crash Course,” by John Pattison, strongtowns.org.

See The Narwhal, “Six developers bought Greenbelt land after Ford came to power. Now, they stand to profit,” November 17, 2022; BlogTO, “All the crazy details about Doug Ford’s controversial stag and doe party with developers,” February 9, 2023.

See The Narwhal, “Ontario’s Durham Region approves developer-endorsed plan to open 9,000 acres of farmland,” May 26, 2022.

Recipes for car dependency

Also published on Resilience

A car-dependent society isn’t built overnight. It takes concerted effort by multiple levels of government and industry to make private cars the go-to, all-but-obligatory choice for everyday personal transportation.

If you want to see what car dependency looks like on a map, you need to look at a regional or neighbourhood scale. You need to see the options people have for the kind of trips they make on a routine, everyday basis.

This series looks at the layout of car dependency in my part of Ontario, Canada.

Durham Region is an administrative district on the east flank of Toronto. The Region covers about 2500 square kilometers, but most of the current population of about 700,000 lives in the southern communities bordering Lake Ontario.

As shown below, there is an extensive network of expressways and major arterial roads connecting Durham Region with itself and with the rest of the Toronto megalopolis. Two east-west expressways cross Durham Region, two north-south expressways cover part of the Region, and there are dozens other highways and major arterials.

A region-scale map. The roads with signs circled in blue are multi-lane, controlled-access highways. Other roads shown in grey are major arterials. Downtown Bowmanville and downtown Toronto are about 75 kilometers apart.

The passenger-rail network, on the other hand, is terribly sparse.

Passenger rail routes through Durham Region, shown in thin blue lines.

One commuter rail line runs east from Union Station in downtown Toronto. It currently terminates in Oshawa, though an extension as far as Bowmanville is promised in a few years. (It’s been promised “in a few years” for more than a few years.) A long-distance line, Via Rail, passes through Bowmanville but does not stop. That means rail travel is not a realistic option for most Durham residents, most of the time, in most directions.

It wasn’t always this way. The passenger rail network was much more extensive a hundred years ago. Though I haven’t found a good map of regional rail lines in the 1920s, there is one from about 50 years earlier:  1875.

Ontario railways constructed or chartered in 1875. Image via Wikimedia Commons.

As shown below, in 1875 Durham Region residents already had not just an east-west connection to Toronto, but two passenger rail lines running north-south through the region. Other lines had been chartered and some were actually built and in operation by the early twentieth-century, though they are a faded historical memory today.

There are many reasons society might have chosen to fund extensive networks of highways, while letting rail networks wither and die. But two powerful industrial lobbies benefitted when passenger rail was eclipsed in favour of private cars. The consumption of liquid fossil fuels rose steeply with the ascent of car culture, to the benefit of Canada’s still large and still influential petroleum industry. And at the provincial level, “by the early 2000s Ontario had become the largest auto-producing jurisdiction in North America.”1

Widespread car dependency is now taken for granted in Durham Region – except by the minority who are either unwilling or unable to get into a car every day. We can illustrate why with the aid of a few more maps.

Living right next to a city about the size of Chicago, in a metroplex of some 7.2 million people, many residents of Durham Region commute to work somewhere in Toronto or its suburbs. For most of these commuters public transit is an unattractive choice.

A major commuter rail line, the GO Train, does connect southern parts of Durham Region to downtown Toronto at Union Station. For those who work near Union Station or one of the other stations, the GO Train may be a great commuting option. For all others, public transit gets more complicated and less attractive.

Consider commuting to what is called “north Toronto” – an area now pretty much in the center of the megalopolis. This area is a typical commuting destination for Durham residents. As the map below shows, the trip is straightforward and relatively quick by car.

Driving from downtown Bowmanville to north-central Toronto, a distance of 64 km, takes about 45 minutes.

To make the same trip by public transit, you need to check schedules carefully and hope your connecting routes run at the hours you need them. Plus, you need to allow 2 to 2.5 hours for the trip that could be done by car in 45 minutes.

Taking public transit from downtown Bowmanville to north-central Toronto takes a minimum of 2 hours. Some of the routes run at reduced frequencies on weekends/holidays, and do not operate late at night.

Let’s look at another, shorter, trip. Ontario Tech University is the only university whose main campus is in Durham Region. Suppose you need to go from downtown Bowmanville to the Ontario Tech campus in Oshawa – just 22 or 23 kilometers. It’s easy by car:

But again, you need to budget more than twice as much time to go by transit:

For these and countless comparable inter-region trips, existing infrastructure and services put tremendous pressure on people who travel by transit. They might consider moving to a residence much closer to their destination – but housing costs are more astronomical the closer you go to Toronto. They might look for a different job or choose schooling closer to home – even if that means settling for a second or third choice. More likely, they might start saving for a car so they can become part of the traffic. And if none of these are possible, they need to devote a large chunk of each day to their commute.

Car dependency takes more than one generation to build – but it’s not always easy to escape.

Stalled in the 1950s

A curious video advertisement was produced for General Motors in 1954. Most ads for car companies show their products cruising along scenic and empty highways. But “Give Yourself the Green Light” took a very different tack: it showed motorists sweating in stalled or crawling traffic, on roads packed with other equally frustrated motorists. In this case GM wasn’t selling cars, at least not directly – they were selling more roads. Specifically, the video was part of an intensive lobbying campaign to persuade voters and car consumers to support massive government expenditures for more and wider highways.2

That expanded highway construction effort still continues almost 70 years later. The roads have gobbled up vast tracts of land and vast sums of tax dollars, but haven’t vanquished the dreaded rush hour traffic tie-ups. Today, rush hours are much longer than an hour, and extend much farther out from city centers, through suburbs and exurbs.

But the current government of Ontario, led by Premier Doug Ford, remains under the spell of that 1950s vision of endless, wide, and free-flowing highways. True, they are now budgetting for and planning major, long-overdue subways and commuter rail expansions in the most crowded parts of the Greater Toronto Area. Perhaps they recognize there simply is no room for wider roads in those areas, and so the only way to reduce congestion is to give more drivers a way to leave their cars at home.

At the edges of urban sprawl it’s another story. Far out from the center of Toronto, where there are still no good public transit options, the Premier is pushing hard to build two more expressways along the north and north-west edges of the metro area. These highly controversial routes, if constructed, will augment ultra-expensive privately run toll road Highway 407, recently extended through Durham Region.

These expressways do more than eat up large amounts of space – which happens to be some of the best scarce farmland in Canada – for travel lanes, medians and interchanges. They also facilitate and encourage equally space-hungry housing forms and commercial developments – developments which will need abundant parking since driving will be the only way to get to and from them.

In the next installment we’ll examine car-dependent development patterns at the neighbourhood level, along with the provincial and regional policies that continue to promote this pattern.


Photo at top of page: Restricted Access – Highway 407 toll route in northeast Durham Region, photographed on Feb 17, 2023. Full-screen image here.


Footnotes

1 The Canadian Encyclopedia, “Automotive Industry”.

The superb series Not Just Bikes includes many excerpts from the GM video along with commentary by vlogger Jason Slaughter, in the recent installment “Would You Fall For It?”

Lost in traffic: does your time count?

Also published on Resilience

Traffic congestion studies make for quick and easy news articles, but they don’t even begin to calculate the true time lost to car culture.

The news story practically wrote itself: Toronto was ranked 7th worst among world cities for traffic congestion in 2022.

A web search showed similar stories popping up all over: “________________ [nearby city] ranks __th worst in world for traffic congestion.”

What did these traffic congestion ratings really measure? That wasn’t usually spelled out in click-bait articles. But a closer look reveals that the ratings measure and value the time spent by one particular class of urban residents – drivers – while omitting the urban mobility costs born by other citizens.

The basis for the recent round of stories was an annual report by INRIX called 2022 INRIX Global Traffic Scorecard. The company describes their work this way:

“INRIX Research uses INRIX proprietary big data, analytics and industry expertise to understand the movement of people and goods around the world. We achieve this by leveraging billions of anonymous data points every day from a diverse set of sources on all roads in countries of coverage. Our data provides a rich and fertile picture of mobility that enables INRIX Research to produce valuable and actionable insights for policy makers, transport professionals, automakers, and drivers.” (2022 INRIX Global Traffic Scorecard, page 27)

The Traffic Scorecard makes brief mentions of transportation methods such as walking, biking and public transit. But these ways of getting around cities don’t count in the Global Traffic Scorecard – even for cities in which they are the dominant types of mobility.

Instead, the Scorecard tallies and values the time supposedly lost by a particular subset of travelers, which happens to include most policymakers, politicians, the upper ranks of media, and mid- and upper-level businesspeople – that is, those who get around cities routinely by car.

For this class of people, an unobtainable ideal is a key factor in calculating the cost of lost time: the standard of “free-flow conditions.” This is the idea that when a large number of drivers are stalled in slow traffic, each one should imagine how fast they could move if most or all of the other drivers were not on the road; then there would be “free-flow conditions.”

It is nonsensical to imagine that in rush hour in a big city, when most people are commuting all at once, you could ever achieve “free-flow conditions”. Nevertheless this ideal is used as the measuring stick for calculating “time lost in traffic”. As INRIX explains their calculations,

“Total time lost is the difference in travel times experienced during the peak periods compared to free-flow conditions on a per driver basis. In other words it is the difference between driving during commute hours versus driving at night with little traffic.” (p. 10)

Using this standard, INRIX calculates that “The typical US driver lost 51 hours due to congestion in 2022.” In the UK, the typical driver lost 80 hours, and in Germany it was 40 hours.

What is this time “worth”? Using figures from the US Federal Highway Administration, INRIX calculates each hour of time lost in traffic as valued at $16.89 in the US, £8.83 in the U.K., and 10.08€ in Germany. Given the numbers of hours lost by each driver, and the large number of drivers, you can come up with large monetary sums for the cost of congestion. INRIX states that traffic congestion cost the US, for example, $81 billion in 2022. These sums will be bandied about whenever lobbyists advocate for more billions to be spent on road widening projects.

Consider the above excerpt from the INRIX report. The seven “most congested” cities all have substantial, sometimes world-famous public transit systems, and all have a substantial portion of population who don’t own or commute in cars.

How does “traffic congestion” affect all the people who don’t drive but still need to get around? Are they less affected by congestion than those poor, benighted drivers? Or are they even more affected? INRIX doesn’t tell us.

Yet in the number one city for congestion, London, only a minority own a car and a much smaller minority use a car for commuting:

“New census data has revealed that just 20 per cent of Londoners commute by car and 41 per cent of London households have no car at all. Yet despite this relatively low level of car ownership, the city is disproportionately designed to incentivise driving. At nearly 20,000 hectares, 12.4 per cent of land in the capital is taken up by roads – significantly more than the just 8.8 per cent of London currently used for housing.” (Dezeen, “Cities should not just build green transport but actively dismantle car infrastructure”, by Phineas Harper, 11 January 2020)

Statistics are similar for New York City: about 45 percent of households own a car, though fewer use cars to commute. (Source: NYCEDC) Even in Toronto, now dominated by its sprawling suburbs, about 28% of households do not own a car, and in some parts of the city non-car-owners are the majority. (Source: Toronto Star)

Do the non-car-users lose as much time to traffic congestion? For people who live close enough to workplaces or schools to walk or to bike, they might well lose much less time in traffic than the average car commuter (though they may still pay a high price in breathing polluted air, while risking being crushed by cars and trucks on unsafe roads).

But one thing is clear: the time lost by non-car-users is neither counted nor valued in congestion surveys like INRIX’s. And when policymakers make important transportation systems decisions based on surveys like INRIX’s you can expect the results to be seriously flawed.

The Gardiner Expressway walls off Toronto from its waterfront on Lake Ontario, and has required ever more costly repairs. In 2021 the Toronto Star reported “The Gardiner will eat up $2 billion of the 2021-2030 capital plan — 38 per cent of total transportation-related infrastructure spending — meaning the city will spend as much rehabilitating the Gardiner as they will on upkeep on every other roadway.”  But a study commissioned by the Gardiner Coalition found that removing the eastern portion of the expressway could add 5 to 10 minutes to the commute times of rush-hour drivers –  so the elevated expressway is still eating big chunks of the city’s budget. Photo by George Socka, from Wikimedia Commons.

Arriving at a good estimate of the time non-drivers lose to traffic congestion is difficult, but that doesn’t make the losses any less real. Take, for example, all the time pedestrians spend waiting at traffic lights while autos either speed or crawl through intersections. Think of the extra time pedestrians must spend walking out of their way to get to a relatively safe place to cross a busy road, and then doubling back to their destination. Think of the time public transit users must wait while their packed buses or trams are stalled behind private cars which each carry one person.

The Jane M. Byrne Interchange of expressways I90, I94 and I294, takes a big chunk of downtown Chicago, eating up a lot of time for non-car-drivers who need to get from one side of the tangle to another. Photo by Sea Cow, April 2022, from Wikimedia Commons.

Other lost-time costs of car culture are even harder to calculate. In many cities where car culture has hegemony, large swathes of urban landscape have been cleared and turned into car lanes plus necessary storage space, i.e. parking. That pushes actual destinations – homes, stores, schools, workplaces – farther apart. The resulting greater travel distances cost everyone more travel time. But above all the people who don’t drive, but still need to get around, lose a lot of their time in getting past expressways, multi-lane arterial roads, and parking lots on the way to their destinations. Traffic congestion studies don’t even begin to quantify the time lost to all this “induced distance”.

Studies like INRIX’s scorecard make for quotable listicles and reverse-bragging rights among the driving class. But beware when this skewed data is put forth as a basis for public policy decisions on transportation infrastructure.


Photo at top of page: Waiting for the lights, Sydney, Australia, photo by Dave Young, license under Creative Commons 2.0, at flickr.com.

Right-sizing delivery vehicles

Cargo bikes can replace far heavier vehicles for a substantial share of urban deliveries. But should you buy a cargo bike for personal use? Probably not.

ALSO PUBLISHED ON RESILIENCE.ORG

In North America we think in extreme terms when it comes to last-mile freight delivery. Whether the cargo is a couple of bags of groceries, a small parcel, a large-screen TV or a small load of lumber, we routinely dispatch vehicles with hundreds-of-horsepower engines.

This practice has never made sense, and there have always been niche markets where some products and parcels have been delivered by bicycle couriers instead of truck drivers. Historically, cargo bikes were in wide use in many cities in the decades before cars and trucks cemented their death grip on most urban traffic lanes.1

Today the cargo bike industry is growing rapidly due to several factors. Many cities are establishing zero-emissions zones. The cost of gasoline and diesel fuel has risen rapidly. Congested traffic means powerful expensive vehicles typically travel at bicycle-speed or slower in downtown areas. Last but not least, the development of low-cost, lightweight electric motors for small vehicles dramatically boosts the freight delivery capacity of e-assist bikes even in hilly cities.

Thousands of companies, from sole-proprietor outfits to multinational corporations, are now integrating cargo bikes into their operations. At the same time there is an explosion of new micro-powered vehicle designs on the market.2

Where a diesel-powered urban delivery van will have an engine with hundreds of horsepower, an electric-assist bike in the EU is limited to a motor of 250 W, or about one-third of one horsepower.3 Yet that small electric motor is enough to help a cyclist make typical parcel deliveries in many urban areas at a faster rate than the diesel van can manage.

A great many other deliveries are made, not by companies, but simply by individuals bringing their own purchases home from stores. In this category, too, North Americans tend to believe an SUV or pick-up truck is the obvious tool for the job. But in many car-clogged cities and suburbs a bicycle, whether electric-assist or not, is a much more appropriate tool for carrying purchases home from the store.

Image from pxhere.com, licensed via CC0 Public Domain.

This is an example of a change that can be made at the device level, rapidly, without waiting for system-level changes that will take a good bit longer. When it comes to reducing carbon emissions and reducing overall energy use, the rapid introduction and promotion of cargo bikes as delivery vehicles is an obvious place to make quick progress.

At the same time, the adoption of more appropriate delivery devices will become much more widespread if we simultaneously work on system-level changes. These changes can include establishing more and larger urban zero-emission zones; lowering speed limits for heavy vehicles (cars and trucks) on city streets; and rapid establishment of safe travel lanes for bikes throughout urban areas.

The environmental impact of deliveries

The exponential growth in online shopping over the past twenty years has also led to “the constant rise in the use of light commercial vehicles, despite every effort by cities and regulators to reduce congestion and transport emissions.”4

Last-mile urban delivery, notes the New York Times, “is the most expensive, least efficient and most impactful part of the supply chain.”5

Typical urban parcel delivery trucks have an outsize impact:

“Claudia Adriazola-Steil, acting director of the Urban Mobility Program at the World Resources Institute’s Ross Center for Sustainable Cities, said freight represented 15 percent of the vehicles on the roads in urban areas, but occupied 40 percent of the space. ‘They also emit 50 percent of greenhouse gas emissions and account for 25 percent of fatalities ….’”6

Since vehicle speeds in downtown areas are typically slow, most parcels are not very heavy, and the ability to travel in lanes narrower than a typical truck is a great advantage, a substantial portion of this last-mile delivery can be done by cargo bikes.

Both Fed-Ex and UPS are now building out electric-assist cargo bike fleets in many Western European cities. UPS has also announced plans to test electric-assist cycles in Manhattan.7

How much of the last-mile delivery business can be filled by cargo bikes? A report by the Rapid Transition Alliance says that “In London, it’s estimated that up to 14% of small van journeys in the most congested parts of the city could be made with cargo bikes.”8 City Changer Cargo Bike estimates that in Europe “up to 50% of urban delivery and service trips could be replaced by cargo bikes….”9

It’s important to note that big corporations aren’t the only, or even the major, players in this movement. Small businesses of every sort – ice-cream vendors, bakeries, self-employed carpenters and plumbers, corner grocery stores – are also turning to cargo bikes. The City Changer Cargo Bike report says that “It is important to highlight that the jobs created by cargo bikes are mainly created by Small and Medium-size Enterprises.”10

For small companies or large, the low cost of cargo bikes compared to delivery vans is a compelling factor. The New York Times cites estimates that “financial benefits to businesses range from 70-90% cost savings compared to reliance on delivery vans.”11

The cost savings come not only from the low initial purchase price and low operating costs of cargo bikes, but also from the fact that “electric cargo bikes delivered goods 60 percent faster than vans did in urban centers, and that an electric cargo bike dropped off 10 parcels an hour compared with a van’s six.”12

It’s no wonder the cargo bike industry is experiencing rapid growth. Kevin Mayne of Cycling Industries Europe says sales are growing at 60% per year across the European Union and could reach 2 million cargo bike sales per year by 2030.

Delivery vans in European cities are typically powered by diesel. Replacing a few hundred thousand diesel delivery vans with e-cargo bikes will obviously have a significant positive impact on both urban air quality and carbon emissions.

But what if diesel delivery vans are switched instead to similar-sized electric delivery vans? Does that make the urban delivery business environmentally benign?

Far from it. Electric delivery vans are just as heavy as their diesel counterparts. That means they cause just as much wear and tear on city streets, they pose just as much collision danger to cyclists, pedestrians, and people in smaller vehicles, and they produce just as much toxic tire and brake dust.

Finally, there is the significant impact of mining and manufacturing all that vehicle weight, in terms of upfront carbon emissions and many other environmental ills. There are environmental costs in manufacturing cargo bikes too, of course. But whereas a delivery van represents a large amount of weight for a much smaller delivery payload, a cargo bike is a small amount of weight for a relatively large payload.

In a listing by Merchants Fleet of the “5 Best Electric Cargo Vans for Professionals”, all the vehicles have an empty-weight a good bit higher than the maximum weight of cargo they can carry. (The ratios of empty vehicle weight to maximum cargo weight range from about 1.5 to 3.5.)13

By contrast, a recent list of recommended electric-assist cargo bikes shows that the ratios are flipped: all of these vehicles can carry a lot more cargo than the vehicles themselves weigh, with most in the 4 – 5 times cargo-weight-to-empty-vehicle-weight range.14

One other factor is particularly worthy of note. The lithium which is a key ingredient of current electric-vehicle batteries is difficult, perhaps impossible, to mine and refine in an environmentally benign way. Lithium batteries will be in extremely high demand if we are to “electrify everything” while also ramping up storage of renewably, intermittently generated electricity. Given these constraints, shouldn’t we take care to use lithium batteries in the most efficient ways?

Let’s look at two contrasting examples. An Urban Arrow Cargo bike has a load capacity of 249 kg (550 lbs), and a battery weight of 2.6 kg (5.7 lbs)15 – a payload-to-battery-weight ratio of about 44.

The Arrival H3L3 electric van has a load capacity of 1484 kg (3272 lbs) and its battery is rated at 111 kWh.16 If we assume, generously, that the Arrival’s battery weighs roughly the same as Tesla’s 100 kWh battery, then the battery weight is 625 kg (1377 lbs).17 The Arrival then has a payload-to-battery-weight ratio of about 2.4.

In this set of examples, the e-cargo bike has a payload-to-battery-weight ratio almost 20 times as high as the ratio for the e-cargo van.

Clearly, this ratio is just one of many factors to consider. The typical e-cargo van can carry far heavier loads, at much higher speeds, and with a longer range between charges, than e-cargo bike can manage. But for millions of urban last-mile deliveries, these theoretical advantages of e-cargo vans are of little or no practical value. In congested urban areas where travel speeds are low, daily routes are short, and for deliveries in the 1 – 200 kg weight range, the e-cargo bike can be a perfectly adequate device with a small fraction of the financial and environmental costs of e-cargo vans.

On Dundas Street, Toronto, 2018.

Cargo bikes, or just bikes that carry cargo?

A rapid rollout of cargo bikes in relatively dense urban areas is an obvious step towards sustainability. But should you buy a cargo bike for personal use?

Probably not, in my opinion – though there will be many exceptions. Here is why I think cargo bikes are overkill for an average person.

Most importantly, the bikes most of us have been familiar with for decades are already a very good device for carrying small amounts of cargo, particularly with simple add-ons such as a rack and/or front baskets.

A speed fetish was long promoted by many bike retailers, according to which a “real bike” was as light as possible and was ridden by a MAMIL – Middle-Aged Male In Lycra – who carried nothing heavier than a credit car. Cargo bikes can represent a chance for retailers to swing the pendulum to the opposite extreme, promoting the new category as a necessity for anyone who might want to carry more than a loaf of bread.

In spite of bike-industry biases, countless people have always used their bikes – any bikes – in routine shopping tasks. And with the addition of a sturdy cargo rack and a set of saddlebags, aka panniers, a standard-form bike can easily carry 25 kg or more of groceries. Or hardware, or gardening supplies, or a laptop computer and set of office clothes, or a stack of university textbooks.

The bikes now designed and marketed as cargo bikes can typically carry several times as much weight, to be sure. But how often do you need that capability, and is it worth the considerable downside that comes with cargo bikes?

Cargo bikes are typically a good bit longer and a lot heavier than standard-model bikes. That makes them more complicated to store. You probably won’t be able to carry a big cargo bike up stairs to an apartment, and you might not sleep well if you have to leave an expensive cargo bike locked on the street.

If you only occasionally need to carry larger amounts of cargo, you’re likely to get tired of riding a needlessly heavy and bulky bike the rest of the time.

If you occasionally carry your bike on a bus, train, or on a rack behind a car, a long cargo bike may be difficult or impossible to transport the same way.

Depending on the form factor, you may find a cargo bike doesn’t handle well in spite of its large weight capacity. Long-tail cargo bikes, with an extra-long rack over the rear wheel, can carry a lot of weight when that weight is distributed evenly on both sides of the rack. But if the load is a single heavy object, you may find it difficult to strap the load on the top of the rear rack so that it doesn’t topple bike and rider to one side or the other. (As one who has tried to load a big reclining chair onto a rear rack and ride down the road, I can attest that it’s harder than it sounds.)

Long-tail cargo bike. Photo by Richard Masoner on flickr.com, licensed via Creative Commons 2.0.


Box-style cargo bike in Lublin, Poland. Photo by Porozumienie Rowerowe, “Community cargo rental”, via Wikimedia Commons.

The large box style cargo bikes known as bakfiets solve those balance problems, but are typically heavy, long, and thus difficult to store. They can be ideal for moving around a city with children, though many parents will not feel comfortable doing so unless there is a great network of safe streets and protected bike lanes.

For people who have a secure storage space such as a garage, and the budget to own more than one bike, and for whom it will often be helpful to be able to carry loads of 100 kg or more by bike – a cargo bike might be a great buy. Or, perhaps a cargo trailer will be more practical, since it can add great cargo-carrying ability to an ordinary bike on an as-needed basis.18

Ideally, though, every urban area will soon have a good range of cargo-bike businesses, and some of those businesses will rent or loan cargo bikes to the rest of us who just occasionally need that extra capacity.

• • •

In the next installment of this series on transportation, we’ll look at a sector in which no significant device-level fixes are on the horizon.


References

See A Visual History of the Cargo Bike, from Mechanic Cycling, Haverford, Pennsylvania.

For an overview of a wide range of new cargo bikes and urban delivery initiatives, see the annual magazine of the International Cargo Bike Festival.

In North America wattage restrictions vary but many jurisdictions allow e-assist bikes with motors up to 750 Watt output.

Stakeholder’s Guide: Expanding the reach of cargo bikes in Europe, published by CycleLogistics and City Changer Cargo Bike, 2022.

“A Bicycle Built for Transporting Cargo Takes Off,” by Tanya Mohn, New York Times, June 29, 2022.

Tanya Mohn, New York Times, June 29, 2022.

Tanya Mohn, New York Times, June 29, 2022.

Large-tired and tested: how Europe’s cargo bike roll-out is delivering, 18 August 2021.

Stakeholder’s Guide: Expanding the reach of cargo bikes in Europe, 2022.

10 Stakeholder’s Guide: Expanding the reach of cargo bikes in Europe, 2022.

11 Tanya Mohn, New York Times, June 29, 2022.

12 Tanya Mohn, New York Times, June 29, 2022.

13 5 Best Electric Cargo Vans for Professionals”, Merchants Fleet.

14 10 Best Electric Cargo Bikes for Families and Businesses in 2022,” BikeExchange, Sept 1, 2022.

15 10 Best Electric Cargo Bikes for Families and Businesses in 2022,” BikeExchange, Sept 1, 2022.

16 5 Best Electric Cargo Vans for Professionals”, Merchants Fleet.

17 How much do Tesla’s batteries weigh?”, The Motor Digest, Nov 27, 2021.

18 One example is the Bikes At Work lineup. I have used their 96” long trailer for about 15 years to haul lumber, slabs of granite, voluminous bags of compost and many other loads that would have been awkward or impossible to move with most cargo bikes.


Photo at top of page: “Eco-friendly delivery with DHL in London: a quadracycle in action,” by Deutsche Post DHL on flickr.com, Creative Commons 2.0 license.

All the king’s horses

ALSO PUBLISHED ON RESILIENCE

When was the last time one of your relatives bought so many victuals they needed a team of a hundred horses to haul the load back from the market?

Perhaps it was that time your great uncle Napoleon was preparing for his not-so-great trip to Moscow.

Or perhaps your great great great uncle Christopher needed a long team of horses to move his groceries before he got in a boat to try to sail to India. Or your extra-extra-great grandpa Richard I, who really bought in bulk before his trip to the Holy Land in 1191.

More likely, though, if you live in North America, somebody from your family needed a team of hundreds of horses to bring home groceries in the past 24 hours – even if they were only picking up a carton of milk or a bag of cheese puffs.

“Need” might not be exactly the right word – but they used a team of hundreds of horses nonetheless, in the sense that they fired up the same hundreds-of-horsepower engine that they use for nearly every local trip no matter how light the cargo.

This grotesque mismatch between the task at hand and the tools we use for that task, have played a large role in pushing us deep into a climate crisis. At the same time, this mismatch can point us to one of the easiest, least painful ways we can move toward true sustainability.

When we look at our dominant car culture, we can consider it from a system standpoint or a device standpoint. On a system level, we have constructed a society in which homes are far from schools, from workplaces, from stores and from entertainment. We have built wide roads and streets that facilitate, at least potentially, high speeds between these newly distant sites. We have devoted most urban public space to huge heavy vehicles that make roads and streets unsafe for pedestrians and cyclists. It took decades to build this environmental nightmare and it will take decades to fix it, even if we run out of cheap energy somewhere close to the beginning of the process.

The previous installment in this series looked at transportation on a systems level, with a call to change lifestyles so that we don’t need to, and we don’t imagine we need to, travel many thousands of kilometres every year. This post takes a narrower focus.

Strictly at the device level, some of the vehicles we use are reasonably appropriate for their typical usage, while many others are beyond absurd.

At the beginning of the 1970s, my summer job was working on a highway construction crew. As an impressionable teenager I was suitably awed when an older man, who worked as a dump-truck driver, showed me his new sports car and told me how powerful its engine was.

I don’t remember the number of horsepower it boasted, but I do remember my Dad’s reaction.

“That is really ridiculous!” my dad exclaimed. “The engine in his car is just as powerful as the engines in all of our gravel trucks!”

My dad was no opponent of car culture – he had a successful career building highways throughout half a dozen US states. But after growing up on a Minnesota farm, driving tractors and grain trucks since before he was ten years old, he had an instinctive understanding of the capabilities and usefulness of different engines.

He understood that for steady work hauling 10 or 15 ton loads, often along hilly highways at speeds up to the speed limit, a 300-hp engine was appropriate. But for hauling one young man along roads with the same speed limits, a 300-hp engine was ludicrous.

As it was in the 1970s, so it is today. Some of the devices we use for transportation – those used to haul heavy freight – have a reasonably powered engine for their assigned task. It will be a difficult challenge to convert their engines from fossil fuels. (Simply moving a lot less freight in the first place is one answer, of course, but that’s a system-level topic beyond the scope of this essay.)

But a greater number of the vehicles on our roads have power systems vastly beyond those needed, even if we accept for the moment that the “need” is to carry a person tens of thousands of kilometres along roads every year, sometimes at speeds of roughly 100 km/hr. There would be no technical hurdles in accomplishing that same task with power systems using a small fraction of the energy. The challenge would be cultural, not technical.

Going nowhere fast. Newly manufactured light trucks awaiting distribution and sale, parked outside GM Canada building in Oshawa, Ontario, Aug 28 2022.

“Get just enough horsepower to do the job.”

That 1970s truck driver whose muscle car impressed the teenage me and perplexed my practical dad? It turns out that by driving a car with the power of a dump truck, he was an avatar of the American future. Today, it is commonplace for Americans to make their daily rounds in cars with the power of dump trucks.

And how much power is that? In 2010, Brian Lindgren, a marketing director for Kenworth Trucks, offered prospective truck buyers this advice:

“One of the big mistakes many people make with dump truck engines is they spec too much power, says Lindgren. ‘You should get just enough horsepower to do the job. Generally, 350 to 400 horsepower is plenty for most applications. Extra horsepower just uses more fuel, puts more strain on the rest of the drivetrain, and adds cost up front.’”

Other trucking-industry publications make similar points: an appropriate horsepower range is somewhere between 300 and 600 horsepower, with the high numbers corresponding to semi-trailer tractors and “Super Dump” trucks carrying highway-legal payloads up to 26 tons.2, 3

This is the kind of advice that makes sense to practical business people who want to earn a profit from their vehicle. For that purpose, there’s no point in forking out a lot of extra cash upfront, and extra cash at every fuel re-fill, for an engine with horsepower far in excess of what’s needed.

Those practical considerations don’t count for much with the typical North American car buyer. The typical cargo is small – just one, and occasionally two or three, warm bodies weighing from 150 – 300 pounds each. But apparently the weight of desire for status, and the weight of drivers’ insecurity, has been on a decades-long climb – at least if we go by the size and horsepower rating of the vehicles they choose to move around in.

This chart by Kevin Drum illustrates the trend: 

By Kevin Drum, from his article “Raw Data: Horsepower of New Vehicles in the US”, on Jabberwocking.

As recently as 1980, when most buyers of pick-up trucks had a day-to-day practical need for such a vehicle, engines were only slightly more powerful than the engines in typical cars. Today pick-up truck horsepower ratings have nearly tripled, while engines in cars have more than doubled.

What that graph doesn’t show is that pick-up trucks have become a far larger share of the automotive market in recent years, as if an epidemic of cattle-ranching or lumberjacking has taken hold in every North American suburb.

A question arises: are today’s four-door pick-up trucks merely oversize cars in disguise, or are today’s oversize SUVs actually trucks in disguise?

Whatever. The US Department of Energy lumps them together with other cars as “light-duty” vehicles, and finds that in this category:

“Preliminary data for model year 2021 show that the average horsepower (hp) reached 252, an increase of more than 6 hp over the 2020 model year.”

If the average new personal passenger vehicle has a 252 horsepower engine, then something like half of those vehicles have a good bit more power – right up into the dump-truck or semi-trailer tractor range.

Car & Driver reported in 2021 that “Finding an SUV with about 400 horsepower is relatively easy these days. That number just doesn’t impress like it once did.”

These days if your personal vehicle has only as much power as an ordinary dump truck, you’re not making much of a statement. But don’t worry – if you’ve got the cash or the credit, you can buy a vehicle with as much or more power as a big, big, big dump truck. Car & Driver lists 15 SUVs and crossover vehicles with power ratings from just under 600 hp to more than 700 hp.

Costs, benefits, and opportunities

What’s the problem, defenders of superpowered cars might ask? After all, just looking at horsepower is an oversimplification that might give the wrong impression. The horsepower rating of passenger vehicles nearly doubled in the period 1989 to 2019, and vehicle weight increased by 24%, but it’s not as if fuel economy has taken a big hit. In fact, average fuel economy improved modestly.

And one ultra-important measure of performance improved dramatically in spite of the extra weight: “acceleration increased (i.e., 0-60 mph times dropped) by 37%.” Car & Driver notes that the most powerful SUV on its list “can get to 60 mph in just 3.6 seconds.”

Just think of all the time that saves a rushed commuter! Between the time a driver leaves a red light and catches up to the snarl of traffic behind the next light, he might save two or three seconds. Between the time he turns onto a freeway on-ramp and the time he reaches the maximum speed that won’t risk an expensive speeding ticket, he might save several seconds, compared to driving with the woefully underpowered vehicles of the 1970s or 1980s. In a long commute with many starts and stops, those precious seconds saved through superior acceleration could add up to a minute or more.

And it’s not as if that massive engine is working hard and really sucking down fuel all the time. Once the vehicle is at cruising speed, power usage is way down and fuel usage is (relatively) lower too.

All true. And yet …. Manufacturing cars that weigh a lot more, and manufacturing millions of bigger engines to propel those heavier vehicles, also has a correspondingly larger carbon footprint. All cars – be they subcompacts or supersize SUVs, gas, diesel, or electric – have resulted in a lot of carbon emissions before the impatient driver even revs the engine for the first time. The more materials used to make that vehicle, the bigger the upfront carbon emissions.

If or when we switch to electric vehicles, those issues of weight and power don’t magically go away. The larger and heavier a vehicle is, the larger the battery needs to be. The larger the batteries, the more scarce minerals we need to mine and refine, and the more high-speed chargers we’ll need to get these big batteries recharged in a reasonable length of time.

We’re in a period when we have a desperate need to curtail fossil fuel combustion, but during which we have only a small fraction of the clean renewable energy installations that would be needed to power an industrial society like ours. It would be folly to continue building bulky, heavy, massively overpowered vehicles to move one or two passengers along roads, and therefore devoting a huge share of our still scarce clean power supplies to building and/or operating that oversized vehicle fleet.

On a system level this is a long-term and complicated problem; we need to dramatically reduce the need to travel far and fast just to get to work or school on a daily basis. But on a device level it is simple. We could build cars that carry one or two people, and occasionally the smaller families that are typical today, plus a typical haul of groceries, at speeds up to but not a lot faster than highway speed limits. We could employ the latest automotive engineering improvements, not to move ever heavier vehicles ever faster, but to power lighter vehicles with the best energy efficiency currently achievable.

As we try to “electrify everything”, with clean renewable energy installations that are still nowhere near adequate for the transition, we should ensure that cars and “light trucks” make the smallest possible demands on our electricity network.

Technically that’s easy but culturally it’s hard. We have an auto industry, after all, whose key to bigger profits has been to persuade people their cars are never big enough or powerful enough. And we have millions of traffic-bound motorists convinced that it really matters whether their cars can go from 0 – 60 in 10 seconds or 5 seconds.

• • •

In the next installment in this series, we’ll look at a combined system-and-device level problem. In the cities where most people live, a big share of vehicle trips don’t actually require use of a car or a truck. How can we change the mode share of urban trips quickly, using existing technologies, and what kind of devices are most appropriate?


Illustration at top of post: detail from Market Economy, composed by author from Creative Commons-licensed images – Horses from image at pxhere.com; wagon and driver from photo by Milo Bost0ck, from Wikimedia Commons; Wal-Mart Supercentre, N Lexington-Springmill Rd, Ontario, OH, photo by Kirk Allen, from Wikimedia Commons; milk carton illustration by Paul Robinson, from Wikimedia Commons; random number background created in Excel.


References

Source: constructionequipment.com.

“How much horsepower does a semi-truck have?” on Trucker’s Corner, August 6, 2019.

“Dump Trucks 101: how to choose the right one”, on customtruck.com

US Office of Energy Efficiency and Renewable Energy Fact of the Week, Feb 7, 2022.

Car & Driver, “Most Powerful Crossovers and SUVs on Sale Today,” Nov 13, 2021.

6 Personal Transportation Factsheet, University of Michigan.

Car & Driver, Nov 13, 2021.

“In 1977, the U.S. average vehicle occupancy was 1.87 persons per vehicle. In 2018, average car occupancy was 1.5 persons per vehicle.” – Personal Transportation Factsheet, University of Michigan.

Hypermobility hits the wall

Also published on Resilience

Imagine a luxurious civilization in which every person has a motorized travel allowance of 4000 kilometers every year, with unused amounts one year carried forward to allow more distant journeys, perhaps every few years. Imagine also that non-motorized travel is not tallied in this quota, so that a person who makes their daily rounds on foot or bicycle can use all or most of their motorized travel quota for those occasional longer journeys.

It’s true that a motorized travel quota of 4000 km per year would seem a mite restrictive to most people in wealthy industrial countries. But such a travel allowance would have been beyond the dreams of all of humanity up until the past two centuries. And such a travel allowance would also mean a significant increase in mobility for a large share of the global population today.

Still, as long as we “electrify everything” why should we even think about reducing the amount of travel?

Australian scholar Patrick Moriarty floats the idea of a motorized travel allowance of 4000 km per year1, based on a recognition that the environmental harms of high-speed and motorized mobility go far beyond the climate-destabilizing emissions that come from internal combustion cars, trucks, trains, planes and ships.

In several articles and a recent book2 Moriarty and his frequent co-author Damon Honnery provide perspective on what Moriarty refers to as “hypermobility”. The number of passenger kilometers per person per year exploded by a factor of 240 between 1900 and 2018.3

“This overall 240-fold rise is extraordinary, considering the less than five-fold global population increase over the same period. It is even about 30 times the growth in real global GDP.”4

The global average for motorized travel is now about 6,300 km per person per year. At the extremes, however, US residents average over 30,000 km per person per year, while in some countries the average is only a few hundred km per person per year.5

Could the high degree of mobility now standard in the US be extended to the whole world’s population? Not likely. Moriarty calculates that if each person in the world were to travel 30,000 km per year in motorized transport, “world transport energy levels alone would be about 668 EJ, greater than global total commercial energy use of 576 EJ for 2018.”6

Increasing mobility services for the world’s poorest people, while decreasing motorized mobility for the wealthiest, is not only an environmental necessity, it is also a matter of equity. As part of examining those issues, we need to ask this simple question: what good is transportation?

We’re moving, but are we getting anywhere?

Moriarty calls attention to an issue that is so basic it is often overlooked: “What people really want is not mobility itself, but access—to workplaces, schools, shops, friends and family, entertainment etc.”7

Sometimes more mobility also means more access – for example, a person acquires a car, and that means many more workplaces, schools, and shopping opportunities are within a practical daily travel distance. But other times more mobility results in little or no gain in access. As two-car households became the norm in many rural areas, grocery stores and even schools consolidated in bigger towns, so that a car trip became necessary for access to things that used to be a walkable distance away in each small town.

Sometimes more mobility for some people means less accessibility for others. When expressways cut through urban neighbourhoods, lower-income residents of those areas may face long hikes across noisy and polluted overpasses just to get to school or a store.8

In the sprawling suburbs of North American cities, people typically drive much farther to get to work every day than their parents or grandparents did 25 or 50 years ago. But to what end? If you can now travel 50, or 70, or 100 km/hr on your commute, but the drive still takes an hour because you go so much farther, what have you gained?

Moriarty asks us to consider to what extent the explosion in mobility – hypermobility – has actually improved the quality of life even for those privileged enough to participate:

“Personal travel levels in wealthy OECD countries are several times higher than in 1950, yet people then did not regard themselves as ‘travel deprived’.”9

While the benefits of hypermobility are unclear, the costs are crushing and unsustainable.

Death rides along

Motorized transportation always comes with environmental costs. These costs are especially high when each individual travels in their own motorized carriage. Only a fraction of these environmental costs go away when a car or truck fueled by internal combustion is traded for an equivalent vehicle powered by electricity.

Many researchers have cited the high upfront carbon emissions involved in building a car or truck. Before the vehicle is delivered to a customer, a lot of carbon dioxide has been emitted in the mining and refining of the ores, the transportation of materials and parts, and the assembly. For currently produced electric cars and trucks, the upfront carbon emissions are typically even higher than the upfront emissions from an equivalent combustion vehicle. It will be a long time, if ever, before that manufacturing and transport chain runs on clean energy sources. In the meantime every new electric car signifies a big burst of carbon already emitted to the atmosphere.

If only the damage stopped there. But building and maintaining roads, bridges and parking lots is also a carbon-emissions intensive activity, with additional negative impacts on biodiversity and watershed drainage.  And though an electric vehicle has no tailpipe emissions, that doesn’t mean that electric driving is pollution-free:

“[N]on-exhaust emissions of fine particular matter from tire wear is actually greater than for equivalent conventional vehicles, because EVs are heavier than their conventionally fueled counterparts.”10

Finally, there is the direct toll from the inevitable, predictable “accidents” that occur when multi-tonne objects hurtle along roads at high speeds:

“In 2018, some 1.35 million people were killed on the world’s roads, with millions more injured, many seriously. Paradoxically, most of the casualties occur in low vehicle ownership countries, and are pedestrians and cyclists, not vehicle occupants.”11

Death reliably accompanies high-speed transportation – but the fatalities disproportionately accrue to those not privileged enough to travel.

Slowing the machine

To recap the argument: the mass production of high-speed vehicles has made possible an explosion in mobility for a privileged portion of the global population. But the energy costs of transportation increase exponentially, not linearly, with increases in speed.  Hypermobility was fueled overwhelmingly by fossil fuels, and even if we could recreate the infrastructure of hypermobility using renewable energies, the transition period would result in a burst of upfront carbon emissions which our ecosystem can ill afford. Finally, if we concentrate on ramping up renewable technologies to serve the rapacious energy demands of hypermobility, it will be more difficult and will take longer to convert all other essential energy services – for producing and distributing foods, for heating and cooling of buildings, and for distributing clean drinking water, to name a few examples – so that they can run off the same renewable electricity sources.

It is clearly possible for a society to prosper with a lot less motorized travel than our hypermobile society now regards as normal. Given the manifold environmental costs and manifest social inequality of a hypermobile society, we need to rapidly cut down not only on the use of fossil fuel in transportation, but also the total amount of motorized transportation as measured in passenger-kilometers (p-k) per person per year. This is the underpinning for Moriarty’s “tentative proposal for an average aspirational target of 4000 vehicular p-k per person per year.”12

But how to begin applying the brakes?

In an article titled “Reducing Personal Mobility for Climate Change Mitigation”, Moriarty and Honnery have examined the likely impacts of various factors on overall motorized mobility. Neither new information technology services, carpooling, or land-use planning changes are likely to result in significant reductions in travel, particularly not in the 10 – 25 year time frame that is so critical for staving off a truly catastrophic climate crisis. Large and rapid increases in the market price of fossil fuels, on the other hand, would dramatically hurt lower-income people while allowing high-income people – who consume by far the most energy per capita – to maintain their current personal habits. Thus Moriarty and Honnery conclude:

“The only equitable approach is to reduce the convenience of car travel, for example, by large travel speed reductions and by a reversal of the usual present ranking of travel modes: car, public transport, and active modes.” [emphasis mine]13

Expressed graphically, that reversal of priorities would look like this chart from Mikael Colville-Andersen’s book Copenhagenize:

From Copenhagenize, by Mikael Colville-Andersen, Island Press, 2018; reviewed here.

At the outset of the motor age, walking and cycling routes were as direct and convenient as possible. As streets were dedicated to fast, dangerous cars, walking and cycling routes started to zigzag through many detours, or they simply disappeared, while priority was given to auto routes.

To make our cities safer and healthier, while also reducing the voracious energy demands of motorized transport, we need to flip the hierarchy once more, putting active transportation first, public transit second, and cars third. That way we can improve access to essential services even as motorized mobility drops.

Within cities where most people live, I think Moriarty and Honnery are right that this change would result in a substantial reduction in overall motorized kilometers per capita, and would do so in a generally equitable manner.

Easier said than done, of course. While many European cities have made major strides in this regard, even timid moves to de-privilege cars are tough for city councils to enact in North America.

A personal travel allotment of 4,000 km per year will seem outrageously low to most North Americans, and it is hard to imagine any North American politician – at least anyone with a hope of ever being elected – saying a good word about the idea.

Yet the luxury of any high-speed travel at all is a recent phenomenon, and there is no reason to take for granted that this extravagance will last very long. We do know that we need drastic, rapid change in our energy consumption patterns if we are to avoid civilization-threatening environmental instability.

We might not find it within ourselves to voluntarily steer away from our high-speed, hypermobile way of life. But if, a few decades from now, our society is in free-fall due to rapid-fire environmental disasters, the complex infrastructure needed for widespread motorized transport may be but a faint memory.

* * *

Though I only came across Moriarty’s work a few years ago, for most of my adult life I unwittingly lived within a motorized travel allotment of 4,000 km/yr – with one major exception. More than 40 years ago, as a new resident of an urban metropolis, I realized it was a bizarre waste of horsepower to use a car simply to haul my (then) scrawny carcass along city streets. Besides, I found it healthier, cheaper, more interesting, and definitely more fun to ride a bike to work, to concerts, to stores, and nearly everywhere else I wanted to go. I was fortunate, too, to be able to choose a home close to my workplace, or change my workplace to be closer to my preferred home; throughout several decades I never needed to regularly commute by car.

But: I did get on a plane once or twice a year, and sometimes several times a year. For many years these air journeys accounted for most of my motorized transport kilometers. Later I learned that of all typical modern travel modes, air travel was the most environmentally damaging and the least sustainable.

In upcoming installments in this series I’ll look at the energy needs, both real and imagined, for personal transportation within cities; and at the impact of hyper-hypermobility as embodied in routine air travel.


Illustration at top of page courtesy of pxhere.com, free for personal and commercial use under CC0 public domain license.


References

See his brief article in Academia Letters, “A proposal for limits on vehicular passenger travel levels”, published in September 2021.

Patrick Moriarty and Damon Honnery, Switching Off: Meeting Our Energy Needs in a Constrained Future, Springer, 2022.

P. Moriarty, “Global Passenger Transport,” MDPI Encyclopedia, February 2021.

P. Moriarty, Academia Letters, “A proposal for limits on vehicular passenger travel levels”.

P. Moriarty, “Global Passenger Transport”.

P. Moriarty, “Global Passenger Transport”.

P. Moriarty, “A proposal for limits on vehicular passenger travel levels”.

For more on the trade-offs between mobility and accessibility see my article “The Mobility Maze”.

P. Moriarty, “A proposal for limits on vehicular passenger travel levels”.

10 P. Moriarty, “Global Passenger Transport”.

11 P. Moriarty, “A proposal for limits on vehicular passenger travel levels”.

12 P. Moriarty, “A proposal for limits on vehicular passenger travel levels”.

13 Patrick Moriarty and Damon Honnery, “Reducing Personal Mobility for Climate Change Mitigation”, in Handbook of Climate Change Mitigation and Adaptation, Springer, 2022, pages 2501 – 2534.


The high cost of speed

Also published on Resilience

Imagine that we used a really crazy method to establish speed limits. We could start by recording the speeds of all drivers on a given stretch of roadway. Then, without any clear evidence of what a safe speed might be, we might argue that the great majority of people drive too fast, and therefore the maximum legal speed will be set as that speed exceeded by 85 percent of drivers. Only the slowest 15 percent of drivers, in this scenario, would be considered to be driving within the legal limit.

If you have a passing familiarity with the legal framework of car culture, you will recognize the above as a simple inversion of the common 85th percentile rule used by traffic engineers throughout North America. Following this guideline, driver speeds are recorded, engineers determine the speed exceeded by only 15 per cent of the drivers, and that speed is deemed an appropriate speed limit for the given roadway. All the other drivers – 85 per cent – will then be driving within the speed limit.

Two recent books argue that the 85th percentile guideline is as arbitrary and misguided as it sounds. In There Are No Accidents, (Simon & Schuster, 2022; reviewed here last week), Jessie Singer summarizes the 85th percentile rule this way:

“Most speed limits are not based on physics or crash test expertise but simply the upper limit of what most amateur drivers feel is safe. A speed limit is the perceived safe speed of a road, not the actual risk of traveling that speed on that road.” (Singer, page 95)

Singer draws on the work of Eric Dumbaugh, who has a PhD in civil engineering and teaches urban planning at Florida Atlantic University. Dumbaugh has analyzed tens of thousands of traffic crashes in urban environments in the US. He concluded that the traffic engineering guidelines used for decades are based on false information, are often misapplied, and result in dangerous conditions on urban roadways. Absent physical evidence of what constitutes a safe driving speed, engineers simply assume that most drivers drive at a safe speed. Dumbaugh doesn’t mince words:

“Traffic engineering is a fraud discipline. It presumes knowledge on road safety that it doesn’t have and it educates people generation after generation on information that is incorrect.” (quoted by Singer, page 96)

The dangerous conditions on roadways have contributed to thirty thousand or more deaths in the US every year since 1946. But the engineers who design the roadways cannot be faulted, so long as they have applied the rules passed down to them in standard traffic engineering manuals.

Confessions of a Recovering Engineer was published by Wiley in 2021.

Similar themes are also a major focus in an excellent book by Charles Marohn Jr., Confessions of a Recovering Engineer (Wiley, 2021). Marohn was trained as a civil engineer, and for the first part of his career he worked as a traffic engineer designing what he saw at the time as “improvements” to roadways in small cities. Over time he began to question the ideas he had absorbed in his education and the guidelines that he followed in his engineering practice.

Marohn is now founder and president of Strong Towns. He has emerged as one of the most vociferous critics of the planning principles underlying American suburbia, and the design guidelines used to justify the arterial roads in those suburbs. He writes,

“The injuries and deaths, the destruction of wealth and stagnating of neighborhoods, the unfathomable backlog of maintenance costs with which most American cities struggle, are all a byproduct of the values at the heart of traffic engineering.” (Marohn, page 5)

These values are held so widely and deeply, Marohn says, that they are seldom questioned or even acknowledged. These values include :

“• Faster speeds are better than slower speeds..
• Access to distant locations by automobile is more important than access to local destinations by walking or biking. …
• At intersections, minimizing delay for automobile traffic is more important than minimizing delay for people walking or biking.” (Marohn, page 12)

Working from his own experience as a traffic engineer, Marohn explains the order in which issues are considered when designing a new or “improved” roadway. First the engineer decides on a “design speed” – a driving speed which the road should facilitate. Next to be established is the traffic volume – all the traffic typically traveling the route at present, plus all the additional traffic the engineer anticipates in the future. At that point the engineer will choose a design based on official guidelines for that design speed and that traffic volume; so long as the guidelines are followed, the design will be deemed “safe”. Finally, the engineer will estimate how much it will cost.

Marohn argues that the questions of whether traffic should move slow or fast, and whether all existing traffic should be accommodated or instead should be restricted, are not technical issues – they are questions of values, questions of public policy. Therefore, he says, issues of the desired traffic speed and desired traffic volume should be dealt with through the democratic process, with public input and with the decisions made by elected officials, not by engineering staff.

Image courtesy of Pixabay.

Some sins are forgiven

In the early days of car culture, traffic casualties happened at a far higher rate per passenger mile than they do in recent decades. Part of the improvement is due to changes in vehicle design – padded surfaces, seat belts, air bags. Part of the improvement can be attributed to what is called “forgiving design”, at least as applied on rural highways. Examples of forgiving design are gradually sloped embankments, which reduce the likelihood of rollovers if a driver veers off the road; wider lanes which lessen the chance of sideswiping; centre barriers which prevent head-on collisions; straightening of curves to improve sightlines; and removal of roadside obstacles such as large trees which an errant driver might hit.

On highways these forgiving design principles make sense, Marohn believes, but on urban arterial roads they are disastrous. He coined the word “stroad” for urban routes that combine the traffic complexity of streets with the high design speeds of inter-city roads. Stroads feature the wide lanes, cleared sightlines and levelized topography of highways, giving drivers the impression that higher speeds are safe. But stroads also have many intersections, turning vehicles, and access points for pedestrians. This means that the higher speeds are not safe, even for the drivers. And vulnerable road users – pedestrians and cyclists – often pay with their lives.

Most stroads should be converted into streets, Marohn says. “Instead of providing drivers with an illusion of safety, designers should ensure the drivers on a street feel uncomfortable when traveling at speeds that are unsafe.” (Marohn, page 43) To ensure that the mistakes of pedestrians and cyclists, and not just drivers, are forgiven, he advocates these guidelines: “Instead of widening lanes, we narrow them. Instead of smoothing curves, we tighten them. Instead of providing clear zones, we create edge friction. Instead of a design speed, we establish a target maximum travel speed.” (Marohn, page 41)

On a typical urban street, with stores, offices, schools, restaurants, and many people moving around outside of cars, that target maximum speed should be low: “Traffic needs to flow at a neighborhood speed (15 mph [24 kph] or less is optimum) to make a human habitat that is safe and productive.” (Marohn, page 56)

In recent years there has been a substantial rise in pedestrian and cyclist fatalities, even as motorist fatalities have continued a long downward trend. The rising death toll among vulnerable road users was particularly noticeable during and following the pandemic. In Marohn’s words we find a good explanation:

“Most [traffic fatalities] happen at nonpeak times and in noncongested areas. … the traffic fatality rate is much higher during periods of low congestion. This is … because the transportation system is designed to be really dangerous, and traffic congestion, along with the slow speeds that result, is masking just how dangerous it is.” (Marohn, 117)

With many businesses closed and many people working from home, there was much less traffic congestion. And without congestion acting as a brake, people drove faster and more pedestrians were killed. That wasn’t intentional, but it was predictable – it was no accident.

* * *

As Jessie Singer explains, we find an extensive matrix of causes that contributes to “accidents” when we look beyond the individual making a mistake. That matrix very often includes racial and economic inequality, which is why poor people suffer more in nearly every accident category than rich people do.

Both racial and economic factors come into play in the current wave of pedestrian deaths. In the major city closest to me, Toronto, pedestrian deaths occur disproportionately among racialized, poor, and elderly people. These deaths also occur most often on wide arterial roads – stroads – in older suburbs.

Marohn’s words again are enlightening: “as auto-oriented suburbs age and decline … they are becoming home to an increasing number of poor families, including many who do not own automobiles.” (Marohn, page 43) When these residents need to walk across four, five or six lane high-speed arterial roads, the predictable result is pedestrian deaths among the most vulnerable. An obvious, though politically difficult, solution is to redesign these roads to bring speeds down to a safe level.

The inequality that contributes to “accidents” is buttressed in most North American cities by an elaborate legal framework telling people where they are allowed to live and work. That legal framework is zoning. In the next installment of this discussion we’ll look at the history and consequences of zoning.


Image at top of page is in public domain under Creative Commons CC0, from pxhere.