“Business As Usual, Electrified” is an awful way to reduce auto emissions

First published by Steady State Herald. Also published on Resilience.

Auto industry voices in Canada have made headlines recently by urging a longer timeline for the transition to electric cars. We should hope that Prime Minister Mark Carney does not give in to this demand.

Yet even if Canada’s federal government sticks to the current policy, and Canadian new car sales are 100 percent zero-emission by 2035, carbon emissions will decline much more slowly than the world needs. That is due to the auto industry’s particularly pernicious strategy for continued growth.

The industry can’t keep boosting unit sales in a country where almost everyone who can drive, does drive. But they can boost revenue by selling bigger, heavier, more expensive vehicles when consumers need to swap their old vehicles for new ones.

With that strategy, Canada’s auto industry has done its part in maintaining the growth of gross domestic product (GDP). But the GDP isn’t all that’s growing. Pedestrian deaths and injuries are growing, tire particulate emissions are growing, traffic congestion is growing, and consumer debt (due to auto loans) is growing.

CO2 emissions from cars are holding steady and should start trending down over the next five years. However, a “Business As Usual, Electrified” transition will reduce emissions far too slowly to meet the climate-crisis challenge.

If you can’t sell more, sell bigger. (GM trucks at former GM Canada headquarters in Oshawa, Ontario, 2022. Photo by Bart Hawkins Kreps.)

Car Bloat in Canada

Statistics Canada figures show that unit sales of passenger vehicles grew just over 20 percent between 2010 and 2024, while population grew 21 percent. Auto sales revenue, however, grew by over 100 percent.

Price tags have soared because the mix of new cars has changed drastically. Most new passenger vehicles are categorized as “light trucks”—SUVs and many models of pick-up trucks. But “light trucks” is a euphemism we should translate as “huge cars.” Most of them are used almost entirely to haul around one or two persons, just like small cars do.

In 2010, the huge-car segment was 54 percent of the Canadian market. By 2024, huge cars made up 87 percent of new passenger vehicles. This trend of “autobesity” or “car bloat” has significant implications for Canada’s strategy to reduce carbon emissions by electrifying vehicles.

First, if the auto industry maintains Business As Usual, the vast majority of internal combustion cars sold between now and 2035 will be huge. They will have correspondingly high tailpipe emissions well after 2035. These emissions are often termed “tank-to-wheel” emissions.

A second emissions category is termed “well-to-tank” emissions. Gasoline or diesel fuel goes from oil wells or mines through an extraction-refining-distribution chain. This adds significant emissions for every liter of fuel burned.

An analogous category—“well-to-grid” let’s call it—exists for electric vehicles (EVs) when electricity is produced by coal- or gas-fired generators. Canada’s grid is powered predominantly by hydro or nuclear power, though, so well-to-grid is not a major category of EV-fleet emissions. (That could change if Canada adopts the “all the above” approach to energy taken by the United States, for example.)

There are also substantial carbon emissions in the manufacture of cars. These emissions are higher for larger cars, and ironically, higher for electric cars than for gas- or diesel-powered cars. If most new cars continue rolling off the assembly lines huge, carbon emissions from auto manufacturing will go up between now and 2035. That will remain true until the carbon-intensive industrial processes in the manufacturing chain are also electrified.

Finally, if Canadians continue to buy as many cars as they do now and drive them as far each year, the fleet of huge cars will continue to take up more roadway surface. Road construction is itself a significant source of carbon emissions.

Beyond the Tailpipe

What will it really take for Canada’s auto industry to reach zero emissions by 2035?  To answer this question, I projected six scenarios using a carbon-emissions calculator developed by the International Energy Agency. I estimated tank-to-wheel, well-to-tank, and auto manufacturing emissions in each of the six scenarios.

I incorporated road construction into my projections, using a Statistics Canada emissions-intensity per dollar estimate, multiplied by total road-construction expenditures for 2024. Passenger cars account for 91 percent of total vehicle kilometers driven, while heavy trucks and buses account for 9 percent. However, trucks and buses individually take more road space than cars. Therefore, I assigned 70 percent of road-construction emissions to the car fleet. (I did not find adequate data to estimate carbon emissions from road maintenance, which would make the analysis closer to complete.)

I estimated passenger-car fleet direct tailpipe emissions at about 72 megatonnes (Mt) of CO2 in 2024. This is slightly less than Environment Canada’s estimate of 74 Mt in pre-pandemic 2019. However, when I added the car fleet’s share of emissions from the extraction-refining-distribution chain, from auto manufacturing, and from road construction, car-sector emissions came to over 115 Mt. That’s a 60 percent increase over the tailpipe emissions alone.


How will this change over the next 15 years? My “Business As Usual, Electrified” (BAU Electrified) projection through 2040 includes two somewhat optimistic assumptions. First, that electrification proceeds on schedule—20 percent of new cars being EV by 2026, 60 percent by 2030, and 100 percent by 2035. Second, that car bloat gets no worse (but also no better) through the coming years. The car/light-truck mix of new vehicles, and the vehicle sizes within these categories, remain exactly as in 2024. Importantly, however, this would mean that the average size of vehicles on the road would continue to increase. This is because the smaller sedans bought ten years ago would be replaced by large SUVs and pickup trucks.

If Canada’s goal of 100 percent EV sales by 2035 is met, total car-fleet emissions will still drop only 41 percent by 2040.

Based on these assumptions, I projected that Canada’s car-fleet emissions would be 41 percent lower in 2040 than in 2024

A 41 percent drop may sound impressive. But climate experts have warned for years that we must reduce global warming emissions by at least 43 percent by 2030. So, a 41 percent drop by 2040 is dangerously inadequate.

Departures from Business As Usual

Making even modest changes to passenger-transportation rules could reduce these emissions significantly faster. I projected five additional scenarios, the best of which shows total car-fleet emissions dropping by 71 percent by 2040.

Modest changes to a “Business As Usual, Electrified” scenario would bring down car-fleet emissions by 71 percent by 2040.

Scenario 2 is only slightly different from BAU Electrified (Scenario 1). It assumes a 98 percent zero-emission electric grid compared to Canada’s current national average of approximately 84 percent zero-emission.

In Scenario 3, the sedan/light-truck mix is dialed back to 2010 levels between 2026 and 2030. In Scenario 4, the sedan/light-truck mix is dialed back to 1979 levels between 2026 and 2030.

Scenario 5 builds on Scenario 4, except that vehicles within the sedan and light-truck categories drop modestly in size. In addition, I projected new-vehicle sales and average kilometers driven as dropping by 3.5 percent per year starting in 2030.

Finally, in Scenario 6 the annual vehicle-kilometer figure begins dropping by 3.5 percent per year in 2026. In Scenario 6, not only have CO2 emissions dropped by 71 percent by 2040, but the drop begins much sooner. The result is that cumulative emissions over the whole period are much lower.

Rising Demand for Electricity

Car bloat is likely to pose one more serious challenge in the effort to shrink overall CO2 emissions. A fleet of huge electric cars will add greatly to demand for electricity, at a time when we are also working to electrify other important sectors, such as home heating. We won’t have enough renewably generated electricity to meet all these demands for many years. Therefore, a rational policy would conduce moderate levels of new electricity demand.

I calculated that a Canada-wide EV fleet matching the BAU Electrified scenario would require 68 TeraWatts (TW) per year. A fleet of mostly small EVs driving about 60 percent as many kilometers a year (close to Scenario 6) would require only 32 TW per year. Either way, this is an almost entirely new source of demand, as we scramble to convert other carbon-intensive sectors simultaneously. But it would be much less challenging to build out a grid capable of providing 32 TW rather than 68 TW. A smaller grid build-out will likewise require less environmentally destructive mining for critical metals.

Business As Usual Is Killing Us

There are many reasons besides carbon emissions to conclude that a “Business As Usual, Electrified” strategy is a bad route. The huge passenger vehicles now dominating the roads compound the danger to pedestrians, cyclists, and anyone driving a smaller car.

Huge passenger EVs need huge batteries—and thus demand a rapid, reckless increase in critical-mineral extraction.

Huge EVs, since they are heavier than corresponding internal-combustion vehicles, create more dangerous particulate emissions from tire wear.

A fleet of huge cars takes up more road space, increasing traffic congestion.

And, huge cars chew up the roads faster, entailing more road construction and repair.

So, we should support the Canadian government’s plan for new-vehicle electrification by 2035. However, we should also demand that new vehicles be smaller, that the number of cars on the road gradually drops, and that vehicles drive fewer kilometers annually. There is a wide range of policies designed to achieve these goals. CASSE’s Sustainable Transportation Act, for example, includes provisions to get passenger vehicles and freight trucks off the road. It also discourages the purchase and use of the largest passenger cars and trucks.

The sooner such policies are implemented, the better—for drivers, non-drivers, our cities, our roads, our waters, our atmosphere, our future.

Electrification is an important and necessary step for a sustainable, healthy future, but growth-driven Business As Usual—even Electrified—is killing us.


This article is based on research presented at the International Society for Ecological Economics/Degrowth conference in Oslo, Norway in June 2025.


Photo at top of page: On Lakeshore Boulevard East, Toronto, Ontario, October 2015. Photo by Lisa Gallant, released under CC0 Public Domain license, accessed via Public Domain Pictures.

The infinite growth of highways

Also published on Resilience.

In the first few pages of his new book Overbuilt: The High Costs and Low Rewards of US Highway Construction, Erick Guerra lays out several essential points. 

First, while the originally planned Interstate expressway system was completed in 1992, the pace of highway construction spending since then has not slowed.

Second, though President Dwight Eisenhower intended the Interstate system – officially initiated by legislation in 1956 – to be rural, most of the construction funding went to urban and suburban sections, and nearly two-thirds of vehicle travel miles in the system also occur in urban and suburban areas.  

Third, though the length of highways may not be increasing, “There are nearly twice as many lane miles of urban interstate” today as in 1990. (All quotes in this article are from Overbuilt, by Erick Guerra.)

But has 70 years of ceaseless highway construction met the stated goals of relieving traffic congestion and making drivers safer?

On the contrary, “The average time spent in traffic per car commuter increased from twenty-nine hours in 1991 to fifty-four hours in 2019.” Meanwhile, “The US traffic fatality rate is two to four times higher than in Canada or wealthy European countries and has improved much more slowly over time than in peer countries.”

From a political economic point of view, it’s easy to understand one reason the highway system continues to grow: construction companies and their investors expect steadily growing revenues and profits, and successfully prevail on politicians to keep the government funds flowing.

Guerra, an urban planning professor at the University of Pennsylvania, provides another reason: the highway lobby has insisted for nearly a century that more highway lanes were needed to relieve congestion. But since more roadway has always induced more traffic, the battle against congestions is never won.

The only thing to do, then, is to keep on adding more highway lane miles. Just as the US economic system demands infinite growth of GDP, its transportation system demands infinite growth of highways.

This fondness for highways seems to match the view of Premier Doug Ford in my current home – Ontario, Canada. Guerra’s book, however, is US-focused and makes only occasional comparative references to other countries. Yet the lessons that emerge from Overbuilt are valuable for any country or city struggling with car dependency.

“Dan Ryan Expressway bridges over 24th Place in Chicago, seen from Archer.” Photo by Eric Allix Rogers, August 2008, accessed via flickr, licensed under Creative Commons BY-NC-ND 2.0.

A history of contestation

Guerra looks back to the early years of the 20th century to trace the growth of the highway lobby, but most of Overbuilt discusses the period since 1956. In that year President Dwight Eisenhower signed the National Interstate and Defense Highways Act into law, and a massive, decades-long construction program shifted into high gear.

Though the legislation was associated with the Interstate expressways (or “freeways” as they were often termed), Guerra makes clear that the commitment of funding was far wider. Indeed, it had to be. As controlled access roadways, expressways don’t provide direct access to any homes, businesses, hospitals, schools, or parks. The expressway system requires an even more elaborate system of feeder highways, service roads and arterials to connect the motoring public with their actual destinations.

Many of these roads cross state lines, and are referred to as (lower-case) interstate highways. The 1956 legislation funded both Interstate and interstate highways at a rate of 90% federal funding to 10% state funding.

The program also funded the acquisition of land for new or expanded highways.

In urban areas, that land was occupied by homes and businesses. By the late 1950s, “New interstates were displacing nearly one hundred thousand families per year but providing no relocation support.” Disproportionately, highways were directed through Black, Brown and poor neighbourhoods. (See Justice and the Interstates for a close look at the ongoing struggle to rebuild these neighbourhoods and provide recompense for families that lost their homes or businesses.)

The highway program was criticized on other grounds as well. For one thing, the phenomenon of induced demand was evident even seventy years ago. Guerra writes that “As noted by early observers such as [US Senator Daniel Patrick Moynihan and [philosopher of technology] Lewis Mumford, increased traffic was generally the largest and most substantial effect of new highway investments.”

Even without adequate payment for expropriation of urban lands, urban highway building is exorbitantly expensive. Guerra writes that about $2.5 trillion (in inflation-adjusted dollars) have been doled out by the federal Highway Trust Fund since 1956 – with most of that funding going to urban highway projects. The spending continues today. Although the Biden administration’s Infrastructure Investment and Jobs Act (2021) has been widely praised for supporting renewable energy and urban public transit, Guerra writes that the Act will also put “hundreds of billions of dollars into building, rebuilding, widening, and maintaining an already overbuilt roadway system.”

This 1973 photo shows “Heavy traffic on the Dan Ryan Expressway in Chicago Illinois. It is the busiest in the United States with 254,700 vehicles daily, according to figures released in March, 1975, by the Federal Department of Transportation. The Kennedy Expressway in Chicago is the second busiest (not shown) with 234,100 vehicles per day.” Photo by John H. White, October 1973. in the holdings of the National Archives and Records Administration. Accessed through Wikimedia Commons.


Meeting peak demand

Going back nearly a century, the nascent field of traffic engineering developed a method that is still used today to provide a rationale for highway expansions.

That method was to peer into the future and guesstimate what the future car and truck traffic demand will be – not to find ways to reduce that demand, but always to provide enough highway space to meet that demand. And not just “meet the demand” but “meet the peak demand”. And not just meet “peak demand” but “demand in the thirtieth busiest hour projected during the next twenty years.”

Why the thirtiest busiest hour, instead of the twentieth or fortieth or one-hundredth busiest hour? Guerra says the choice was arbitrary, but was codified as a standard nevertheless. But the choice to plan and build highways to meet demand in the 99.98th percentile busiest hour has kept highway builders busy, and made the US ever more car-dependent, ever since. Due to induced demand, however, the new or expanded highways quickly fill up and even the demand during routine weekday “rush hour” stays ahead of roadway supply.

Guerra shows how gas-tax revenues from less-than-peak hours are used to subsidize traffic at the most congested times – the reverse of congestion pricing. Accordingly, he cites congestion pricing as one of the most significant ways to reverse the pattern of overbuilding.

But surely all these roadway “improvements” have led to greater public safety? Many highway engineers will claim success on that front, pointing to a drop in deaths per Vehicle Mile Travelled (VMT). Guerra responds:

“From 1955 to 1980, the fatality rate per vehicle mile had halved. To put it succinctly, Americans were driving nearly twice as much, thanks to wider and higher-capacity roadways, and killing about the same number of people after adjusting for population growth.”

In agreement with engineering professor and author Wes Marshall (Killed by a Traffic Engineer), Guerra believes we should discuss traffic risk primarily on a per capita basis as is done with most other public health hazards. Judged on this basis, the expanding highway system looks like a very bad safety investment:

“The places with the most highways have the most arterials, the most local roads, the most driving, and the most traffic fatalities. Across urban counties, each 10 percent increase in roadway per capita corresponds with about a 4 percent increase in traffic fatalities per capita.”

A looming fiscal crisis

Of course the highway system can’t keep on expanding forever, given the finiteness of land and resources. Guerra writes that “the current transportation finance model is unsustainable and fast approaching a fiscal crisis.”

Thus the first step to ending the pattern of overbuilding is to stop funding new highways, and stop maintaining, and even dismantle, some of the highways now in existence. A second step, as mentioned previously, is congestion pricing.

Better funding for public transit might help too, but Guerra cautions that in most areas of the United States, public transit is nowhere near competitive with cars in terms of travel times and convenience; increased funding may convince very few drivers to switch to transit. Such is the legacy of 70 years of induced car dependency.

He also draws on the distinction between accessibility and mobility to advocate another change:

“Measuring accessibility – people’s ease of getting to the places they are trying to go – instead of mobility – traffic speeds, traffic volumes, and highway capacity – is perhaps the single most important shift that needs to take place to begin to evaluate and assess the impacts of transportation investments properly. Movement and traffic are quite simply the wrong way to measure the transportation system.” p 162

Guerra has done a great job of describing the recipe for overbuilding. But the recipe for converting an overbuilt network into a safe, sustainable transportation system is still being worked out in countries and cities around the world.


Photo at top of page: “Passing over the Dan Ryan Expressway, with a good view of the skyline in the background.” By The West End, August 2008, accessed via flickr, licensed under Creative Commons BY-NC-ND 2.0.

Facilitating a dangerous way of life – traffic engineers in a car culture

Also published at Resilience.

Wes Marshall calls attention to a paradox about the profession in which he began his career:

“It would make sense to assume that newer cities, built with all the knowledge that traffic engineers continue to accumulate, should be our safest cities. But that is not the case. It’s the older cities—mostly built before traffic engineers existed— that tend to be safer.” (Killed by a Traffic Engineer, p 202) 

Elsewhere in the pages of his new book, Marshall notes that the paradox extends to areas within cities as well: “Streets built before the advent of traffic engineers are some of our safest, often with far fewer fatalities and severe injuries than the new-and-improved, fully traffic-engineered versions.” ( p 257)

Killed By A Traffic Engineer, by Wes Marshall, Island Press 2024.

Marshall is now a professor of civil engineering and urban planning at the University of Colorado Denver. He distills 25 years of learning into Killed By a Traffic Engineer: Shattering the Delusion that Science Underlies our Transportation System. (Island Press, April 2024) While he would like to see his profession become an agent for sustainability, safety, and conviviality, that will require a radical transformation of goals and methods.

The book is an extended take-down of the idea that the voluminous design guidelines, published by groups such as the American Association of State Highway and Transportation Officials (AASHTO), provide evidence-based formulas for safe roads and streets.

Marshall argues that in fact these guidelines, far from prioritizing safety, put traffic volume and speed first. To the extent that safety is considered, he says, safety is typically viewed from the perspective of the drivers, and not those outside cars or trucks. Finally, he demonstrates through extensive historical research that many of the engineers who worked with or developed the guidelines over the past 70 years were aware that supporting evidence was lacking or fragmentary. 

Given the above summary, readers interested in transportation systems and planning might wonder if Marshall’s book largely repeats points made by Charles Marohn in his excellent book Confessions of a Recovering Engineer. (Wiley, 2021)

There is some overlap and the messages of the two books are strongly complementary. Yet Marshall includes so much relevant detail, and such insightful probing of engineering and safety research, that Killed By A Traffic Engineer is worth every minute invested in reading its 344 pages, even for those who have already read Marohn’s work.

Marshall’s focus is almost solely on traffic engineering practice in the United States, but residents of car-dependent areas in other countries are likely to find a great deal of relevance in the book. 

In this review we’ll look at a few of the major topics Marshall covers.

First, there is the poor quality of evidence, and frequent misapplication of that evidence, underlying many traffic engineering guidelines. Second, the “factor of safety” used successfully in structural engineering often has contrary consequences in fields that, like traffic engineering, should account for human behaviour. Finally, using per-vehicle-mile safety metrics, instead of per capita metrics, blinds us to the true danger of a society in which driving substantial distances is an obligatory daily ritual for most people.

“Fatal accident on 32 Ave & 68th St NE, Calgary, Alberta, August 2008.” Photo by RAF-YYC, from Wikimedia Commons.

What didn’t they know, and when didn’t they know it?

A nascent field of study got its own scholarly journal when the Eno Foundation began publishing the Traffic Quarterly in 1947. The journal, which was later renamed Transportation Quarterly, continued until 2003 – and it appears that Marshall has read every article in every issue.

Rather than simply assume that the current massive tomes of road and street guidelines are based on extensive safety research, Marshall quotes many Quarterly articles to establish the contrary.

An important case of misapplied data was passed down as Heinrich’s Law, or the “accident triangle”. In 1931, Travelers Insurance employee H.W. Heinrich examined some data on industrial accidents. He determined that “In a workplace, for every accident that causes a major injury, there are 29 accidents that cause minor injuries and 300 accidents that cause no injuries.” (quoted by Marshall, page 94)

Would this same relationship apply in other settings or in other time periods? Who knows? Yet it became widely accepted among traffic engineers that a similar proportional relationship would exist between very serious crashes, moderately serious crashes, and crashes resulting in only minor dents or scratches to cars.

If  a steady, proportional relationship existed between accidents of differing severity, then it would follow that by reducing all accidents of any sort, we would reduce the serious accidents that maim or kill people.

This fixed proportional relationship was an illusion, but it was often a convenient illusion. Particularly when comparing the crash rates of specific locations, data on serious accidents might be too sparse to draw any valid inferences. Aggregating all crashes, however, might seem to provide an adequate number of data points.

As Marshall points out, this methodology cast a harsh light on downtown areas. Such typically congested areas often have a relatively high number of crashes. But since speeds are low, most of the crashes will be fender-benders.

Higher-speed arterials may have few fender-benders, but more serious injuries or fatalities.

An analyst working on the assumption that the total number of crashes was a reliable proxy for serious crashes would label the downtown locations “more dangerous” and the arterial roads “less dangerous”. This line of thinking led traffic engineers, more than sixty years ago, to try to improve safety by lessening congestion. Marshall writes:

“For much of the history of traffic engineering, we considered traffic congestion to be a proxy for road safety. As our good friends over at AASHO1 inform us in their 1957 manual on urban arterials, ‘Congestion breeds accidents.’” (p. 99)

Marshall highlights weaknesses in available data sets in other respects as well. He writes that the best accident data for the whole US is the Fatality Analysis Reporting System (FARS). The FARS reports contributing causes, but unless there are eyewitnesses or surveillance footage, the police often have no reliable way to determine something as basic as the speed the driver was driving. This results in a set of statistics that stretches credulity:

“Over a recent six-year period, 28,642 pedestrians lost their lives on streets with a posted speed limit. How many of the drivers who killed these 28,642 pedestrians were speeding? According to FARS, the answer is 2,015.

“Go look at almost any road. Does it seem within the realm of possibility that the speeding problem is limited to 7 percent of drivers? Of course not ….” (p 236)

Suppose the fatal crash report does include speeding as a contributing cause. It is all too easy to conclude “case closed”: the driver was to blame for speeding. But how much sense does this make, in a system where most roads are designed to facilitate speeds higher than the speed limit, where cars are marketed with the promise of exhilarating and consequence-free speed, where law enforcement seldom tickets drivers who are driving modestly above the supposed maximum legal speed, and where most drivers speed whenever the roads are free enough of congestion to allow this? Is it really sensible, in such a system, to simply blame the driver for speeding in those cases where an accident results, when the driver is doing what nearly all drivers routinely do?

Even more to the point, Marshall argues, traffic engineers will only contribute to safety when they stop focusing on the after-the-fact blaming of individual drivers, and work instead to design roads where speeding is not the predictable and average behaviour.2

Why a margin of safety may increase danger

Civil engineers, Marshall writes, typically receive much more instruction in structural engineering than in traffic engineering. But some eminently logical practices in structural engineering do not transfer well to traffic engineering.

An engineer designing a bridge support might calculate the strength needed to support the maximum expected weight, and then double the size of the pillar to add a “factor of safety”. An engineer designing a culvert might estimate maximum water flow, and then double the size of the culvert to add a factor of safety.

The double-strength pillar does not induce heavier trucks to cross the bridge, and the double-size culvert does not induce more rain to fall, so the factors of safety hold true.

But suppose traffic engineers work in the same fashion. Starting from the specified design speed and the estimated traffic volume, they consult the guidelines and sketch a roadway with a certain number of lanes of a certain width, with a certain amount of space beside the road that is cleared of any obstacles such as trees or parked cars. Then, to create a factor of safety, they might increase the width of the lanes, add a lane or two, and increase the amount of clear space beside the road.

In this case the factor of safety is counter-productive. The extra lane(s) induce more traffic to travel on the newly widened road, while the wider lanes and wider visual clear space result in drivers speeding up. With more traffic traveling at higher speeds, the risk of serious injury or fatalities is increased, not decreased, by the “factor of safety”.

“car accident @ vestavia hills”, Birmingham, Alabama, July 2011, photo by Rian Castillo, licensed under Creative Commons ATTRIBUTION 2.0 GENERIC, accessed via flickr.

The fatal flaw in “per vehicle mile” safety metrics

Traffic safety is often quantified using a per-vehicle-mile, or per-million-vehicle-mile, ratio. This has serious consequences. Marshall writes,

“Conventionally, distance traveled is the denominator in our crash rates. The number of crashes, injuries, or deaths on our roads is the numerator. You’d think that focusing on reducing the numerator so as to improve crash rates makes the most sense. The problem is that we’ve instead focused on increasing the denominator. In other words, given the way we measure road safety, we all seem safer if we all drive a lot more. We built places that force us to do so. Crashes go up a little, but we drive a lot more, so we’re convinced we improved safety.” (p 356)

Marshall supports his point with both a hypothetical example and with real-world data.

He asks us to consider the fictional towns of Driveton and Heresville. They each have lost 150 citizens in traffic crashes over the past 10 years. Does that make them equally safe?

Well, the average citizen of Driveton drives 25,000 miles per year, while citizens of Heresville only average 5,000 miles per year. Driveton’s fatality rate is 1.2 deaths per 100 million vehicle miles – approximately the US average – while the fatality rate in Heresville is 1.5 deaths per 100 million vehicle miles. If vehicle miles is the denominator, then Heresville is 25 per cent more dangerous than Driveton.

But consider one more important piece of data. Driveton has 50,000 people, while Heresville has 200,000. But they have the same number of annual fatalities. A citizen of Driveton has four times as much chance of dying in a traffic crash as a citizen of Heresville. And yet, Marshall writes, “conventional traffic engineering metrics tell us that Driveton is safer.” (p 85)

Using a per capita metric, rather than a per vehicle mile metric, tells us something crucially important about car-dependent mobility systems.

Marshall looked at 24 years of data from the US Fatality Analysis Reporting System. This data set includes the zip code of the drivers, and population density data is also available for each zip code. After grouping zip codes into twelve categories ranked from highest to lowest population density, Marshall writes, 

“What I found is that those living in the most urban places in the United States experience safety outcomes on par with the safest countries in the world. It gets worse and worse at every step in between until you reach the most rural places, which are on par with the most dangerous countries in the world. The difference? In the United States, you are six times more likely to die on the roads if you live in the most rural areas than in the most urban.” (p 92)

When we use a population metric, rather than a vehicle mile ethic, it’s clear that traffic violence is a greater risk to people who live in more car-dependent areas.

“One of the greatest barriers to road safety is having to drive everywhere, all the time, even for the simplest errand,” Marshall concludes. “More specifically, the greatest barriers to road safety are the places we’ve built that force people to drive everywhere, all the time, even for the simplest errand.” (p 356)

Traffic engineers have aided and abetted that car-dependency, by prioritizing vehicle capacity, speed and throughput on our roads and streets. Making safety the priority – that is, shrinking the per capita rate of traffic deaths and injuries – will require new ways of thinking. Traffic engineers will need to think about why public transit is a non-existent or unattractive option for so many people, and what they can do to help make good transit possible. Traffic engineers will need to plan streets that are safe for children to cross without worried adults hovering around them. Traffic engineers will need to plan streets that people with reduced physical ability can cross safely, and without going hundreds of meters out of their way. Traffic engineers will need to co-ordinate with urban planners to promote neighbourhoods where residents can routinely go shopping, go to school or work, and meet and visit with friends without getting into cars.

Traffic engineers will need to focus more on accessibility, and less on mobility.3

As Lewis Mumford wrote in 1963, in one of Marshall’s favourite quotes, “A good transportation system minimizes unnecessary transportation.”4


Notes

1 American Association of State Highway Officials, the precursor of today’s American Association of State Highway and Transportation Officials.

2 This is a perspective also discussed at length in Jessie Singer’s 2022 book There Are No Accidents, reviewed here.

3 For a discussion of the difference between mobility and accessibility, see The Mobility Maze.

4 Lewis Mumford, The Highway and the City, 1963, quoted by Marshall, page 359.


Image at top of page:, “Multi vehicle accident – M4 Motorway, Sydney, NSW, October 2012, photo by sv1ambo, from Wikimedia Commons.

Turning a new leaf in suburbia

Also published on Resilience

Social critic James Howard Kunstler referred to suburban sprawl as “the greatest misallocation of resources in history.”1 In his view, “The suburbs have three destinies – as slums, salvage yards, and ruins.”2

While agreeing that suburbs in their current form are “hopelessly maladapted to the coming world of energy descent,” permaculture pioneer David Holmgren nevertheless believes that “Low-density detached housing with gardens is the ideal place for beginning a bottom-up revolution to recreate the household and community non-monetary economies that our recent forebears took for granted as the basis for an adequate, even comfortable, life.”3

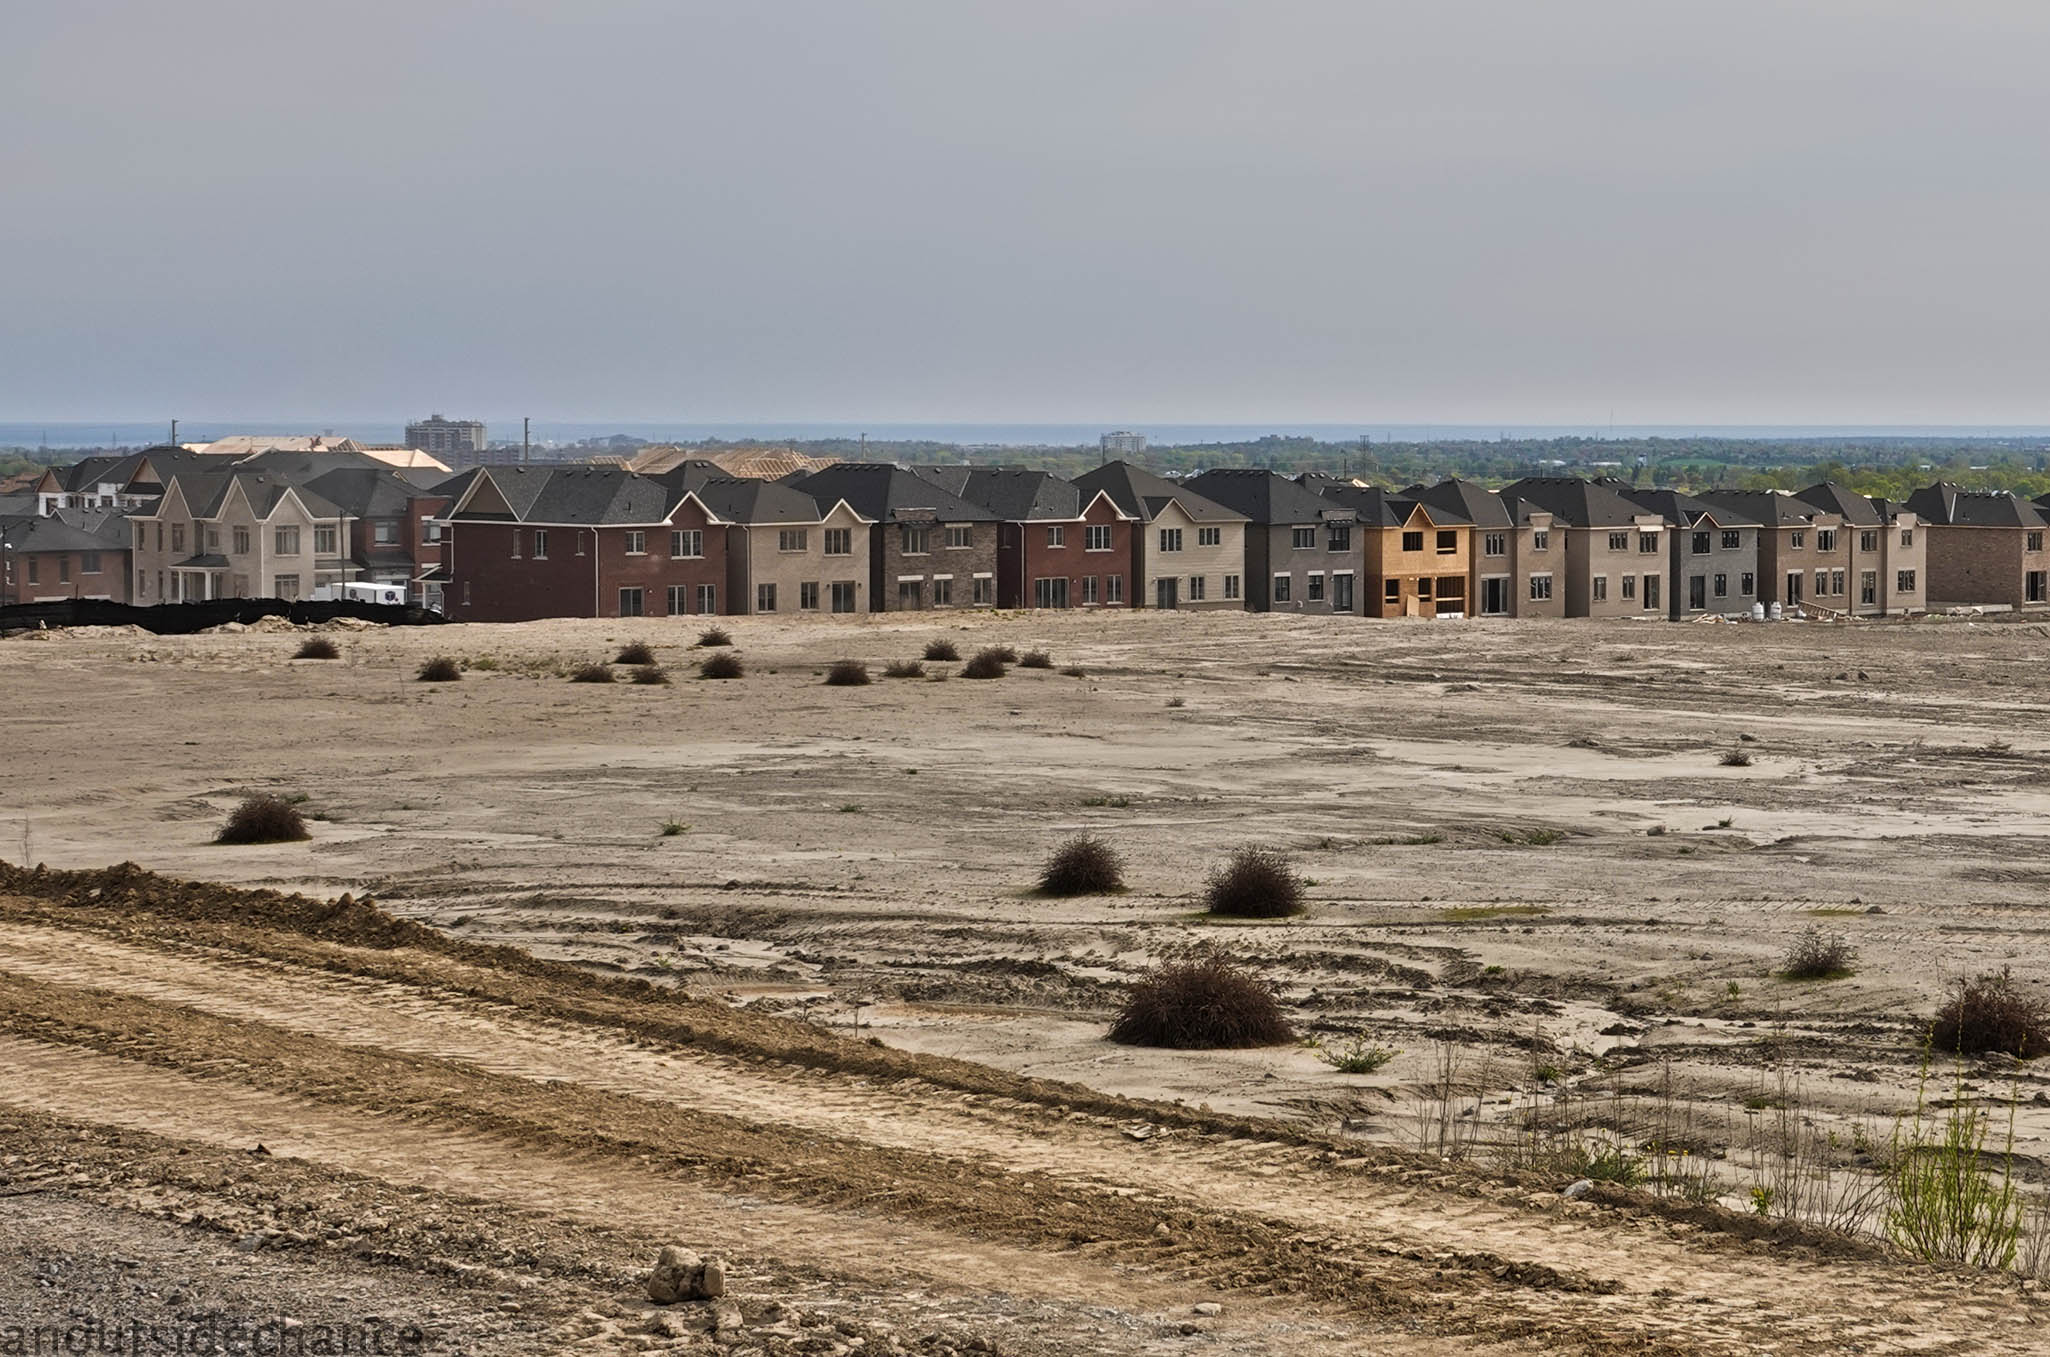
Suburbs have not come to an end – I’m my region, in fact, they are still adding suburban sprawl like there’s no tomorrow. Signs of positive transformations of suburban developments exist across North America, but you might need to look carefully to notice.

This post will look at some of those signs of transformation and how they might be accelerated. In contrast to the last post, Can car-dependent suburbs become walkable communities?, this post and the next will focus mostly on small-scale initiatives.

The major theme of this series of posts has been the contrast between car-dependency and walkable communities. Walkability is a transportation issue, of course, but it is more than that.

It is often said that transportation planning and land use planning are two sides of the same coin.4 It’s important to look at both issues, not only as they are addressed in government policies, but also as they are addressed by individuals or small groups of neighbours.

For the purposes of this discussion, three key features of suburbia are:

  1. zoning rules that mandate the separation of residential districts from commercial districts and industrial districts;
  2. the default assumption that people will drive cars from their homes to workplaces, stores, cultural events, and recreational facilities; and
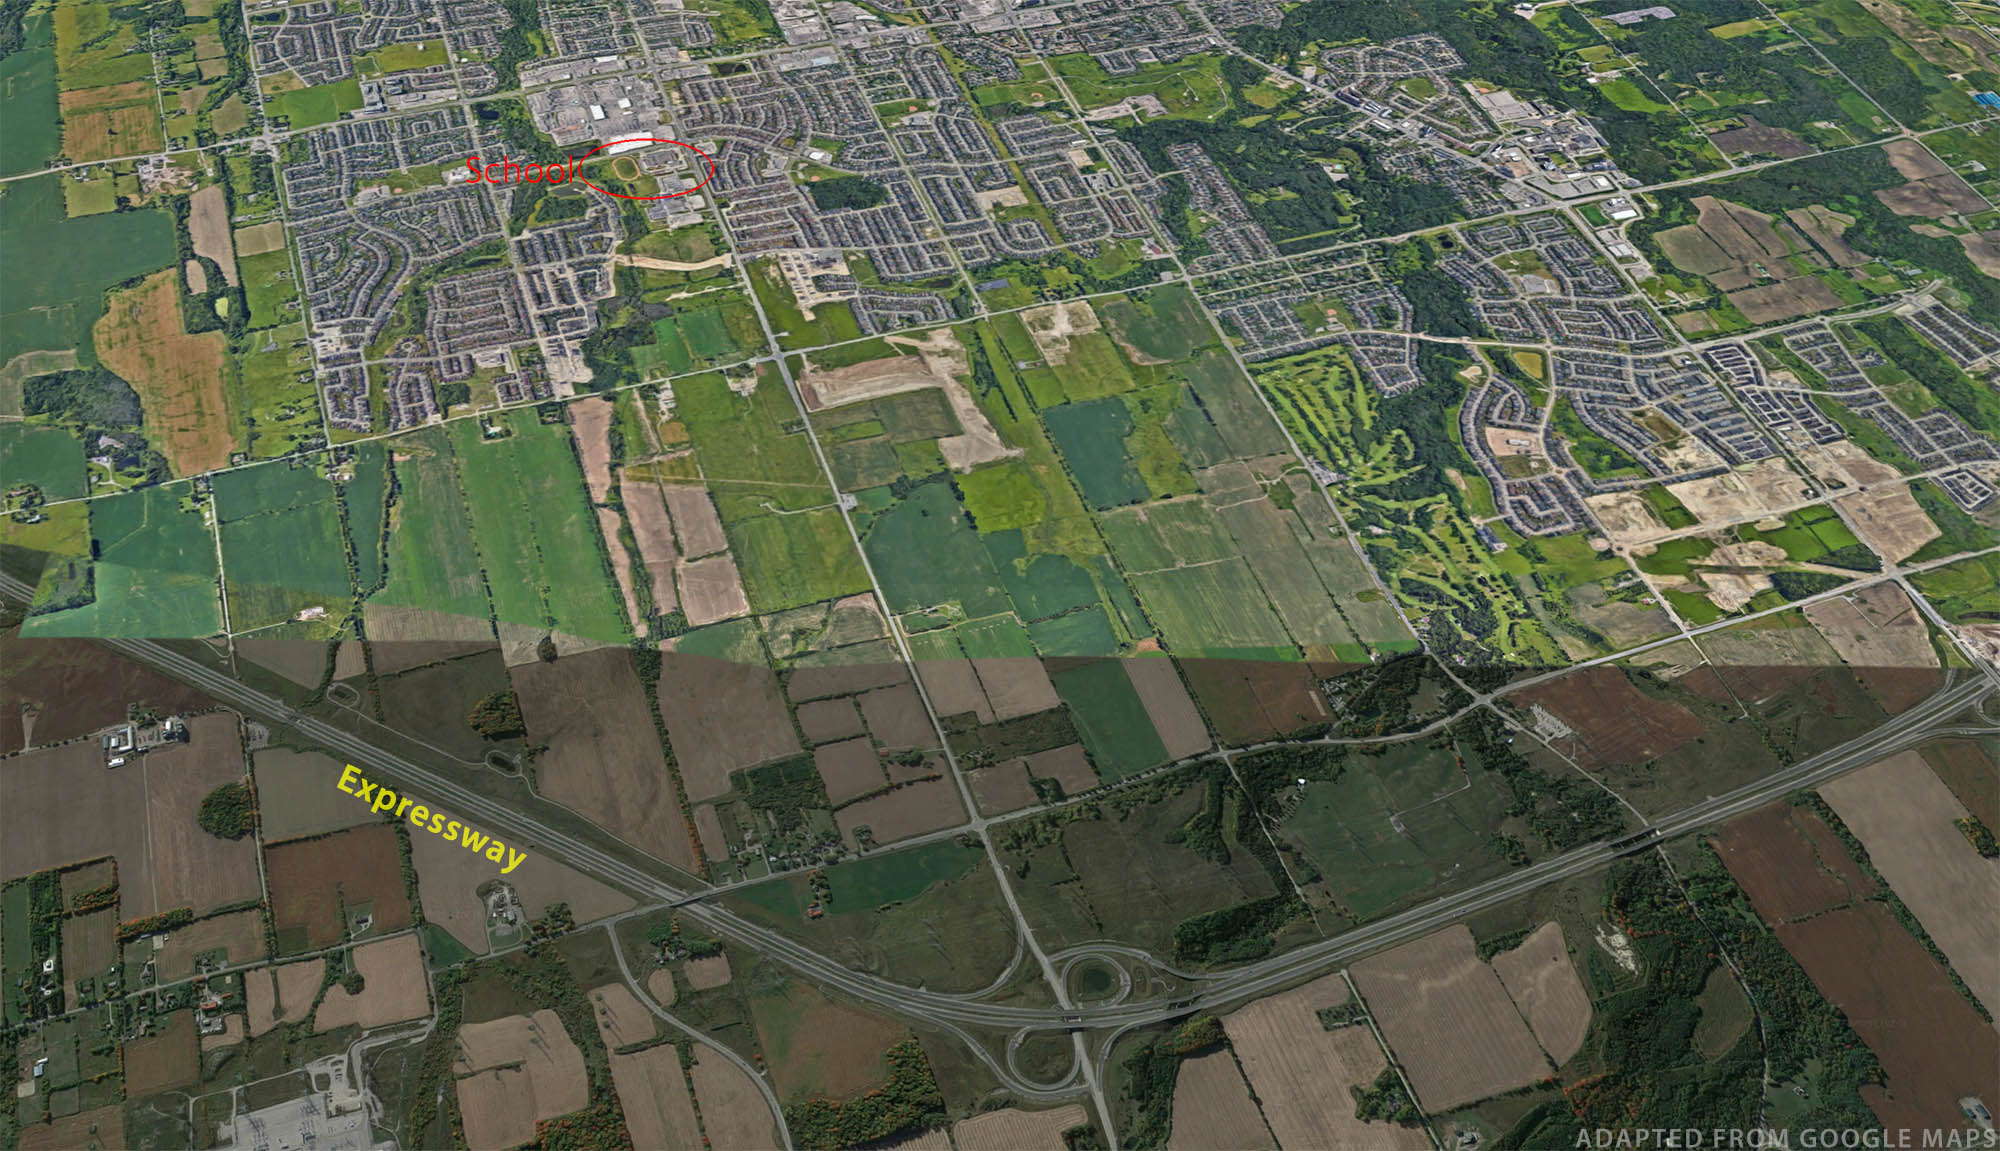
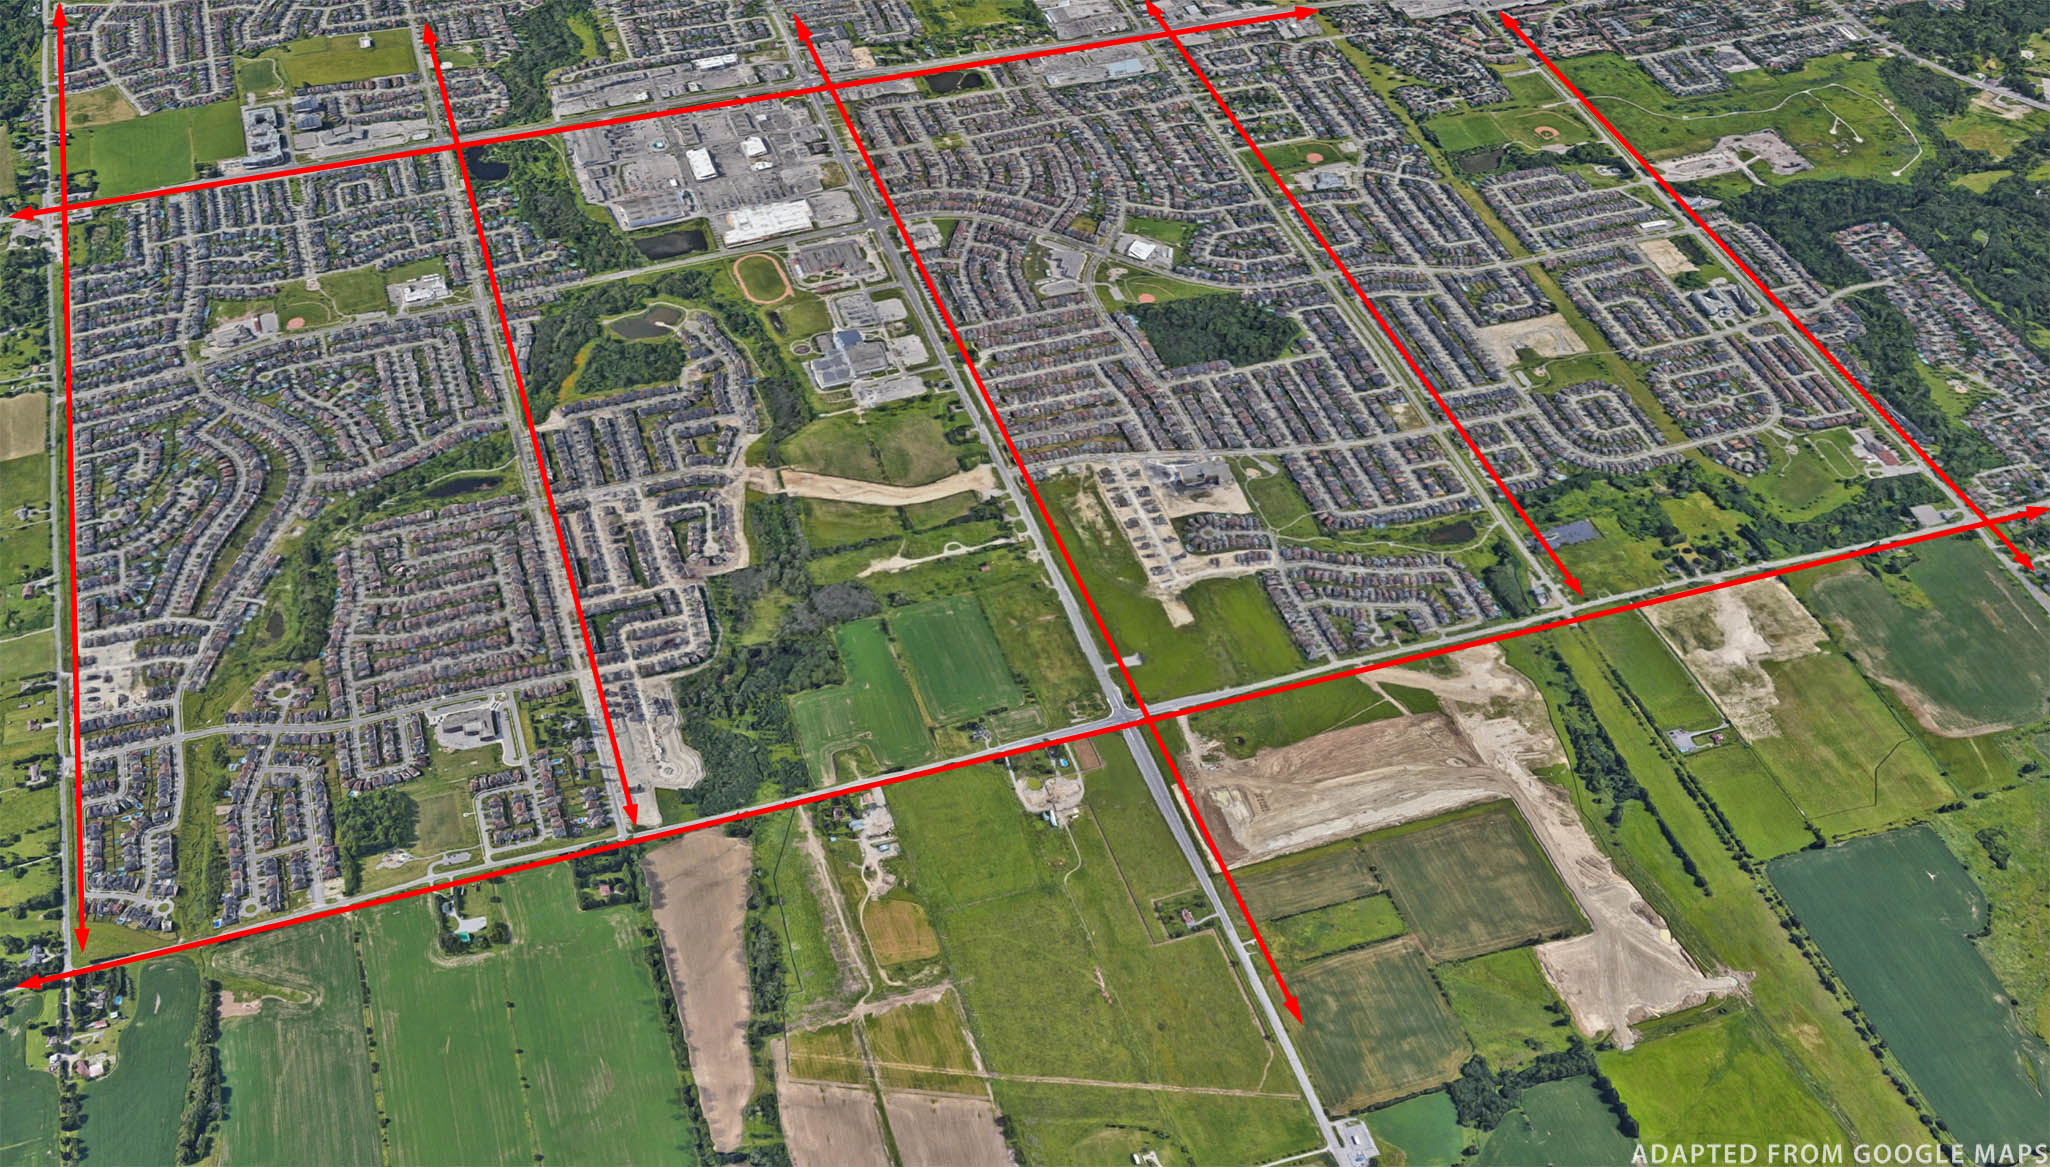
  3. the organization of the resulting car traffic into maze-like local residential streets, larger collector streets, six-to-eight lane major arterials, and expressways.

These basic parameters have many implications as discussed in previous posts. The practice of driving everywhere means there also needs to be parking at every location, so that a typical suburban district has several parking spaces for every car. (See How parking ate North American cities.)

The funneling of traffic to bigger but more widely spaced roads leads to traffic jams during every rush hour, and dangerous speeding when traffic volumes are low. The dangerous collector and arterial roads put vulnerable road users, such as pedestrians and cyclists, at risk of death or serious injury in getting from their own immediate neighbourhoods to other neighbourhoods. (See Building car-dependent neighbourhoods).

And the low residential and employment density of sprawl makes it difficult and expensive to build public transit systems that run frequently and within a short walk of most residents. The result is that suburban sprawl seldom has good transit, which in turn strongly reinforces car-dependency. (See Recipes for car dependency.)

Change will not be optional

Notwithstanding the difficulties of transforming the suburban pattern, I believe it will happen for this simple reason:

That which is not sustainable will not be sustained.

First, suburban sprawl is not financially sustainable, particularly in the governance arrangements we have in North America. As Strong Towns has demonstrated through numerous articles, podcasts and videos, North American suburban expansion has been a Ponzi scheme. While expansion infrastructure is usually paid for through a combination of federal government and developer funding, local municipalities are left with the liabilities for infrastructure maintenance and eventual replacement. That wouldn’t be a problem if the new districts could raise sufficient property tax revenue to cover these liabilities. But they don’t.

Low-density housing tracts, interspersed with one-story shopping centers and strip malls, all surrounded by expansive parking, don’t bring in nearly as much property tax/acre as denser, multi-story developments in older downtown districts do. The low tax revenue, coupled with very high maintenance-replacement liabilities for extensive roadways, parking lots, and utilities, eventually catch up with municipalities. And then? Some can keep the game going, simply by getting more funding grants for even further sprawl – thus the “Ponzi scheme” moniker – but eventually they run out of room to expand.

As Charles Marohn has written, “Decades into this experiment, American cities have a ticking time bomb of unfunded liability for infrastructure maintenance. The American Society of Civil Engineers (ASCE) estimates deferred maintenance at multiple trillions of dollars, but that’s just for major infrastructure, not the local streets, curbs, walks, and pipes that directly serve our homes.”5

Worth noting is that as climate instability forces infrastructure reconstructions to happen more frequently and to higher standards, the pressure on municipal governments will be even more intense. And as energy costs spike higher, fewer residents will be able to afford the long commutes in private cars that they now take for granted.

When suburban municipalities face bankruptcy, what will the choices be? Certainly one choice is to abandon some areas to become, in Kunster’s words “slums, salvage yards, and ruins.” For reasons explained below, I think it’s more likely that municipalities will allow more varied and denser developments than are currently permitted by zoning codes, so that a larger property tax base can help cover infrastructure liabilities.

Suburban sprawl is also likely to prove unsustainable at the level of individual homes. Debt has grown rapidly in recent decades, and a great deal of that debt is in the form of mortgages by homeowners – many of whom live in the far reaches of suburbia.

Jeff Speck wrote “The typical American working family now lives in suburbia, where the practice of drive-’til-you-qualify reigns supreme.”6 Due to a dearth of affordable homes inside American cities (and in Canadian cities as well), new home buyers have only been able to qualify for mortgages far from urban cores. The price for somewhat cheaper housing, however, is that each working member of the family is likely to need a car to get to and from work. In Speck’s words,

“The average American family now spends about $14,000 per year driving multiple cars. … Remarkably, the typical ‘working’ family, with an income of $20,000 to $50,000, pays more for transportation than for housing.”7

When families are paying for the biggest mortgage they qualify for plus the cost of keeping two or more cars on the road, the shock of higher interest rates, a rise in unemployment, and/or higher gas costs can be too much to sustain. Referring to the 2007-2009 oil price spike and economic downturn, Speck explains that “as gasoline broke $4.00 per gallon and the housing bubble burst, the epicenter of foreclosures occurred at the urban periphery.”8

In coming economic crises, on a collective scale or an individual scale, I wouldn’t expect the suburbs to be abandoned or to be torn down en masse and rebuilt. Frankly, I don’t expect society to be wealthy enough to simply start over in other places or following other patterns. Instead, I would expect both municipal governments and individuals to muddle through by making a wide range of adjustments. And some of those are starting already.

The household as a place of production, just consumption

As Samuel Alexander and Brendan Gleeson have written, “Built environment change is slow and contested. In a developed city, turnover (additions and alterations) in the built stock is typically much less than five per cent per annum.”9 But while buildings, lots and streets may change slowly, the activities that go on there may change more rapidly.

One significant change has been happening already, in spite of zoning rules that typically disallow the change.

In a post titled “Your Home Office Might Be Illegal,” Edward Erfurt wrote,

“The frontline zoning battle for the right to work out of your home hit center stage during COVID. Under most zoning codes, we are all breaking the law.”10

He adds that “Working from home and working out of a home has become normalized. … Others have even taken the next incremental step of leaving a corporate job to open a new business in our homes.”

Simply turning a blind eye to zoning violations is one thing, but Erfurt urges municipalities to take a proactive approach:

“Home Occupations should be permitted by right in every zoning category in your community. Whether you are working remotely for a large corporation or running your own business, you should have the right to do this within your home. Cities should encourage home occupations as a tenet of their economic development strategy, and a single line could be added to any code to focus the planners.”

Robert Rice describes how the dynamic is now playing out in Houston:

“This is how the Suburban Experiment really ends: not with explosive legislation, but with regular people making the best of what they have. In Houston, what we have is houses. I propose that these new house-businesses, home offices, and de-facto multifamily residences are the first increment of intensity for a suburban neighborhood.”11

Some of these changes are taking place in accord with current law and some in defiance of current law. However, many jurisdictions across North America are now changing rules to allow modestly greater density in residential areas, including in suburbs. Travis Beck recently wrote:

“Minneapolis, for example, ended single-family zoning effective January 2020, allowing the construction of duplexes and triplexes on all residential lots. Oregon passed legislation in 2019 requiring cities with populations above 25,000 to allow construction of duplexes, triplexes, and fourplexes on all residential lots. And California’s 2021 Senate Bill 9 allows the construction of duplexes on residential lots and the splitting of sufficiently large lots into two parcels, effectively allowing four housing units to be built in place of one.”12

Even the province of Ontario, infamous for bungled attempts to enrich land speculators by fast-tracking sprawl on previously protected lands, recent legislation specifies that “up to three residential units are permitted ‘as of right’ on most land zoned for one home in residential areas without needing a municipal by-law amendment.”13

Intermittent additions of one or two residences per lot may seem insignificant compared with the scope of the housing crisis; such zoning changes are certainly not sufficient to make suburbia sustainable. Yet such changes provide for greater flexibility in housing options and promote actions by individual property owners and small contractors, in contrast to the large developers who are often spoken of as the only actors who can solve the housing crisis. Paradoxically, the pace of densification on a lot-by-lot basis could pick up in an economic downturn, if significant numbers of homeowners decide it makes sense to downsize their overly-large residences by creating one or two rental units.

It’s not only the number of residential units and the number of residences that matter, but also the kinds of activities that happen in residential neighbourhoods. As discussed above, a large number of suburban homes are now de facto workplaces. The work done in and around homes, whether or not that work is counted in official economic statistics, could become a greater factor in the suburban economy.

The Victory Garden movements of the last century encouraged people to raise food in their own yards, whether they lived in cities, the nascent suburbs, small towns or rural areas. In the US, during WW I about one-third of US vegetables came from Victory Gardens. By 1943 during WW II, there were 12 million Victory Gardens in cities. A Wikipedia article notes that “While Victory Gardens were portrayed as a patriotic duty, 54% of Americans polled said they grew gardens for economic reasons while only 20% mentioned patriotism.” (Image on left is a WWI-era poster from Canada; at right is WWII image from use. Images and data from Wikipedia article Victory garden.)

One of the key features of most suburbs, visible from the street or from the air, is the small- or medium-size plot of lawn adjacent to each single-family dwelling. But the biological desert of the standard lawn can easily be replaced with something much more life-giving. Alexander and Gleeson write:

“Digging up backyards and front yards and planting fruit and vegetables, keeping chickens, and composting, are important practices, reconnecting people with the seasons, the soil, and the food on their plates. In the words of permaculture activist and educator, Adam Grubb, we should ‘eat the suburbs’.”14

A frequent objection to this idea is that few people could raise all their own food on a typical suburban lot. Quite true, and quite beside the point. More relevant is that many and perhaps most suburban residents could raise a significant portion of their fruits, vegetables, herbs, eggs, and other foods if they choose. In the process, they and their communities would become more resilient while promoting greater local biodiversity.

Suburban landscapes often include many other strips of green, kept semi-alive through regular mowing and sometimes watering: strips between areas of parking lots, in front of strip malls, on medians within major arterials, within the “cloverleafs” of expressway interchanges. Alexander and Gleeson invite us to imagine the transformation of these areas:

“Over time, we can imagine food production crossing beyond household boundaries, too, re-commoning public space. This is already under way, as people reclaim nature strips for food production, plant fruit trees in the neighborhood, establish community gardens, and cultivate unused land through “guerrilla gardening.’”15

Alexander and Gleeson write in an Australian context. In North America, a great example of similar change is the work of permaculture proponent Jan Spencer in Eugene, Oregon. Over the past twenty-three years he has transformed his quarter-acre suburban lot into an oasis. Starting with an 1,100 square foot home fronted by a driveway big enough to park six cars, Spencer gradually turned the driveway and surrounding spaces into three-dimensional gardens, added enough water tanks to collect thousands of gallons of rainwater to keep his gardens happy through the typically dry local summer, and built a 400 square foot living space for himself so he could rent out three rooms in the house.16

As Spencer explains, a key permaculture principle is to design each change so that it meets multiple purposes. With his changes he has, among other things, increased the residential density of his property, provided an income for himself, taken major steps toward food security, added carbon storage, buffered the effects of extreme heat, drought, and rainfall, and reduced the draw on city utilities such as the water system.

Such activities hold the potential of turning the suburban household “into a place of production, not merely consumption.”17

Trip generation

What do home offices and front-yard gardens have to do with transportation? Recall the incantation of traffic engineers: “trip generation.”

A home with, for example, two adult residents “generates” fewer trips when one of those adults can work at home most days instead of commuting. The home will generate fewer trips to buy groceries if the household grows a lot of their own vegetables in the summer, and perhaps puts up some of those vegetables for the winter too.

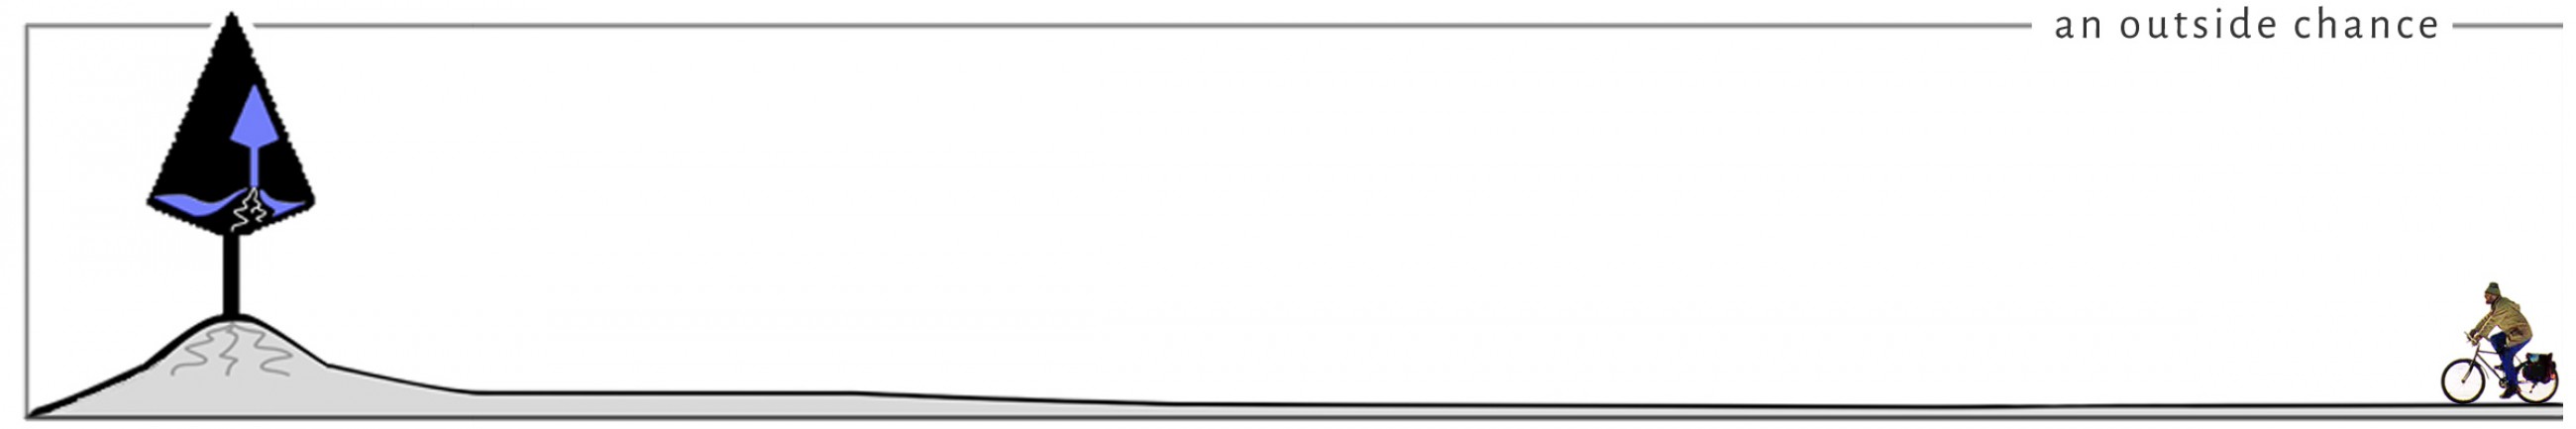
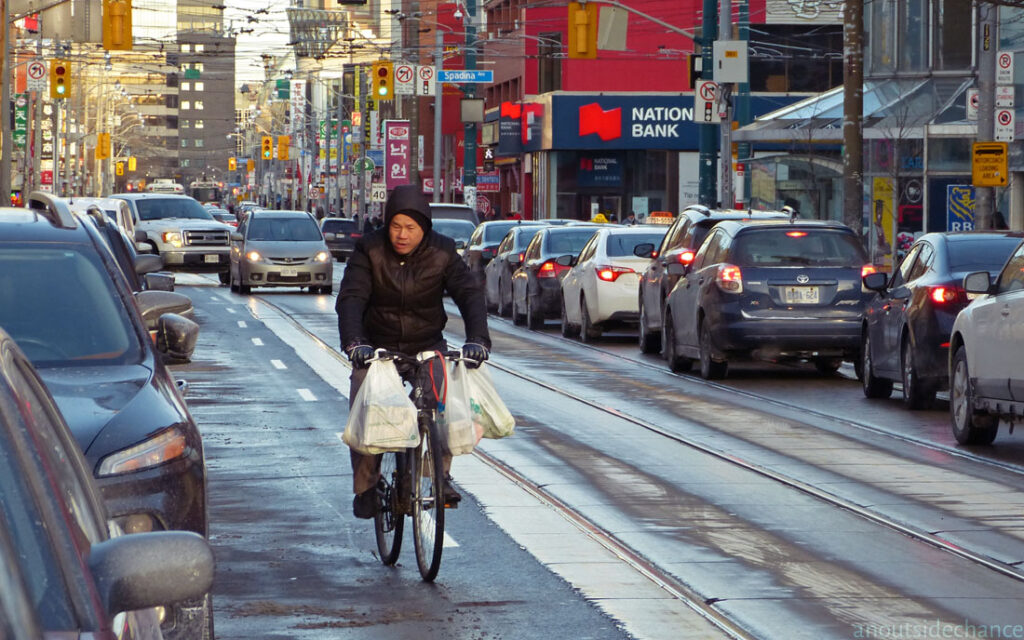
A family with two or three cars for each working member may find they can trade one of those cars for a bike, taking the bike on grocery runs much of the time. Each family which reduces the number of cars they own not only reduces traffic, but also reduces the number of parking spaces needed both in their immediate neighbourhood and at the stores, schools or workplaces they can reach without driving. Which, in turn, makes it more feasible to gradually increase the number of residences in a neighbourhood or the number of stores in a shopping plaza, as the need to devote precious space to parking is reduced.

Obviously, not every suburban resident can make these type of lifestyle changes at present. Just as obviously, we don’t need all, or even most, suburban residents to become car-free before we see a major impact on traffic patterns and usage of public transit. Finally and obviously, only a limited number of people will willingly bike or walk outside of their immediate neighbourhoods until we make the roads safe for them, and few people will willingly switch to public transit if the service is slow, infrequent, or unreliable.

So zoning and land use changes, while necessary, are not sufficient to transform car-dependent suburbia into sustainable, walkable communities. Many changes to transportation policy and infrastructure are also needed. Some of these will require governments to play a major role, but many can be initiated by small groups of neighbours who see immediate problems and advocate or demonstrate simple solutions. Those changes will be the subject of the next post in this series.


Notes

1 TED talk transcript, April 20, 2007.

2 Quoted by Leigh Gallagher in The End of the Suburbs, Penguin Books, 2013; page 206. As an aside, it was in Gallagher’s book that I first learned of the Strong Towns movement; I have been learning from their blog posts, books, podcasts and videos ever since.

3 Foreword to Degrowth in the Suburbs, by Samuel Alexander and Brendan Gleeson, Palgrave Macmillan, 2019; page vii.

E.g., see Land Use Impacts on Transport: How Land Use Factors Affect Travel Behavior, by Todd Litman, Victoria Transport Policy Institute, Victoria, BC. Page 3.

“America’s Growth Ponzi Scheme,” Strong Towns, May 18, 2020.

Walkable City, 10th Anniversary Edition, by Jeff Speck, Picador, 2022; page 30.

7 Walkable City, page 30.

8 Walkable City, page 30.

9 Degrowth in the Suburbs, page 12.

10 Edward Erfurt, “Your Home Office Might Be Illegal”, on Strong Towns blog, Oct 13, 2023.

11 Robert Rice, “The End of Suburbia Starts with Disobedience,” on Strong Towns blog, Oct 13, 2023. Rice explains both the differences and similarities between the deed restrictions that are common in Houston, and the zoning-based restrictions much more common in most American cities.

12 In “ADUs Can Help Address The Lack Of Housing. But They’re Bad Urban Design.” by Travis Beck, Next City, Oct 5, 2023.

13 From “Backgrounder: More Homes Built Faster Act, 2022”, Ontario Government Newsroom, November 28, 2022.

14 Degrowth in the Suburbs, page 133.

15 From “Suburban Practices of Energy Descent,” by Samuel Alexander and Brendan Gleeson, Energy Transition and Economic Sufficiency, Kreps & Cobb, editors, Post Carbon Institute, 2021; page 189.

16 See Spencer’s description of this project in “Transforming suburbia,” on Resilience.org, October 6, 2023, and a video tour of Spencer’s property conducted by Laura Sweeny of Raintree Nursery.

17 “Suburban Practices of Energy Descent,” page 190.


Image at top of page: Levittown, PA, circa 1959, adapted from public domain image at Wikimedia Commons.

Can car-dependent suburbs become walkable communities?

Also published on Resilience

“The majority of urban areas in most cities today are car-dependent,” writes urban planner Tristan Cleveland, “leaving little room for walkable growth unless cities can convert large areas of existing suburbs into pedestrian-oriented neighbourhoods.”

Yet the processes of change are even more difficult in suburbs than in urban cores: “The barriers to walkable design are greatest in such suburban contexts, where the momentum for car-oriented design is most entrenched.”

Cleveland is an urban planning consultant who works with Happy Cities, a consultancy based in Halifax and Vancouver. His 2023 PhD thesis, Urban Intercurrence, is a thorough, enlightening, readable, jargon-lite study of how and why some suburban districts embark on the transition from car-dependent sprawl to walkable neighbourhoods. (A tip of the hat to Strong Towns, where I first learned of Tristan Cleveland’s work through this podcast interview.)

The work’s subtitle – “The Struggle To Build Walkable Downtowns In Car-Dependent Suburbia” – indicates an important limitation in scope. This is not a study of attempts to convert a car-dependent suburb as a whole, but more simply to develop a high-density, walkable district within a larger suburb. Even so, Cleveland demonstrates, the pitfalls are many and successes to date are partial at best.

Cleveland’s insights make for a good follow-up to recent posts here on car-dependent development. A first post, Recipes for Car-Dependency, looked at car-dependent development on a regional scale, in which a superfluity of highways and major arterial roads is matched with scarce, infrequent public transit. The second post, Building Car-Dependent Neighbourhoods, focused on car-dependent development at a neighbourhood scale.

But once car-dependent regions and neighbourhoods are established, is it possible to retrofit them, in whole or in part, to escape this car-dependency?

In my opinion it is not only possible, but is probably inevitable – though it may take a long time and it may involve difficult disruptions. Probably inevitable, because the suburban lifestyle is built on and presupposes cheap energy to power swarms of private cars which each carry one or two occupants many kilometers to work, school, and shopping on a daily basis. When this energy is no longer available and affordable to most residents, car-dependent lifestyles will change by necessity.

In the meantime, some residents and municipalities are already promoting car-lite or car-free lifestyles for other important reasons: to improve public health by simultaneously reducing air pollution and the diseases of sedentary lifestyles; to build social cohesion by encouraging more people to walk through their neighbourhoods to local shops; to cover rising infrastructure maintenance costs by achieving compact urban and suburban developments with a higher tax base; to make frequent and timely public transit possible in districts with sufficient population density.

As Cleveland notes, walkable neighbourhoods are in high demand but scarce supply, leading to sky-high rents and real estate prices in such districts. And since most North Americans now live in suburbs, providing the walkable neighbourhoods many people would prefer to live in will necessarily involve a significant degree of suburban retrofitting.

Urban Intercurrence provides detailed looks at four concerted attempts to build walkable downtown districts in suburbs. One is in a suburb of Vancouver, another in a suburb of Toronto, a third in a classic “edge city” in the orbit of Washington, DC, and one about ten miles from downtown Miami, Florida.

Before diving into the specifics of each project, Cleveland provides a valuable primer on a hundred years of car-prioritized developments. This history is essential to understanding why the retrofit examples have all had slow and limited success.

The history review and the examples are relevant and useful to transportation activists, environmental justice activists, municipal planners and officials.

Intercurrence and inverse feedback

For a PhD thesis Urban Intercurrence is remarkably light on specialist jargon, and Cleveland also defines clearly what he means by words or phrases that may be unfamiliar to a lay audience. Many of the issues he discusses will be familiar to any activist who has attended public meetings in favour of adding bike paths, reducing width of car lanes, or repurposing some of the vast area now devoted to car parking.

There is, to be sure, an out-of-the-ordinary word in the thesis title. Cleveland adopts the word “intercurrence” from political science, where it refers to “the ways in which multiple, contradictory paradigms of thought and practice can co-exist within institutions, and how their contradictions can shape policy.” (Pg 5. Unless noted otherwise, all quotes in this article are from Urban Intercurrence.)

The contradictory paradigms sometimes come from professionals who are educated with different orientations. In recent decades the urban planning profession has been strongly influenced by the movement to create safe, attractive, walkable districts, Cleveland says. Traffic engineering departments, on the other hand, tend to prioritize the swift and unimpeded movement of vehicles. Both groups are involved in suburban retrofits, and sometimes the result is a project that spends much public money to encourage walkability, and just as much or more money widening car lanes on more roadways, thereby discouraging walkability.

A paradigm like car-dependency tends to be self-reinforcing. If nearly all the residents in a district travel by car, then shopping centers have their doors opening to large parking areas, instead of opening directly to a sidewalk where the rare pedestrian might pass by. If each single-family home needs two or three parking spaces, then residents and their municipal councillors typically fear that even a mid-size apartment building will overwhelm the neighbourhood’s parking supply.

Nevertheless, car-dependency sometimes causes discontent with car-dependency. In many suburban areas today, roadways are so chronically congested that voters are ready to approve new public transit systems. At the same time, housing developers used to building low-density, car-dependent subdivisions may switch to advocating for high-density developments once they’ve used up most of the available land.

Cleveland writes, “I refer to these contradictory feedback processes — which undermine car-dependence, reinforce walkability, or at least enable a shift towards walkability — as ‘inverse feedback.’” (pg 5)

He cites clear examples of competing paradigms and inverse feedback in each of the four suburban retrofit case studies. In each case, inverse feedback provides an opening for walkability advocates to initiate change. Importantly, however, when car-oriented interests offer support to walkability, that support is limited and insufficient to result in a walkable neighbourhood:

“To complete a shift to walkability, it is necessary, at some point, for walkability to begin to reinforce itself on its own terms, at the expense of car-dependence. That is to say: it is necessary for walkable interests to identify as such, to defend their needs, to establish separate standards, and to normalize those standards. It is also essential for walkable development to achieve a sufficient scale that it can begin to attract other, similar growth. Car-dependence may cause backlash that inspires change, but to complete change, it is essential for those who have a direct stake in walkability to complete the transformation.” (pg 6)

The timeline is long, very long

Two important facts jump out when reading the four case studies of retrofits. First, change in these instances is primarily a top-down process, promoted and initiated by local governments, major developers, or both. Second, the move to walkability has taken thirty or forty years, with action stalled for years in some cases, and while significant progress has been made, none of the four projects have yet fully realized their original goals.

In Surrey, BC, a suburb of Vancouver, formal planning for a walkable downtown district began in the 1980s. Zoning changes alone failed to convince developers to build high-density projects geared to walkability. The city finally took major steps in the 21st century, building a new city hall and public library complex in a prime location. Even then developers hesitated, so in 2007 “The city established the Surrey City Development Corporation (SCDC), an arms-length company for which the city remained the sole shareholder, but which could raise capital, build market-oriented development projects, and partner with other development firms to help to encourage them to invest.” (pg 134)

The new developments were located adjacent to a station of the SkyTrain, a commuter train that goes to downtown Vancouver. The existence of the SkyTrain helped convince many car-dependent residents to support a walkable, high-density Surrey City Centre. However, this expensive transit line made it difficult to get funding for other intra-suburb lines that might have been of even more benefit in freeing Surrey residents from car-dependency. As Cleveland explains:

“A SkyTrain can appeal to otherwise car-dependent voters because it can replace the one trip that is most difficult to make by car — commuting through traffic to work — and it can also help to alleviate rush-hour traffic by replacing some of those car trips. And it does not consume road space. However, a SkyTrain to downtown does not meet the needs of people who rely on transit for everyday trips, such as going to daycare, visiting friends, or buying groceries. … A high-speed connection to the downtown makes one kind of trip faster, but does little to enable a complete transit-oriented lifestyle throughout one’s community.” (pg 145-146)

SkyTrain route from Surrey City Centre to downtown Vancouver (image via Apple Maps)

The interplay between transport decisions made by different levels of government has been a complicating factor in all four of the the suburban retrofits Cleveland examines.

Spontaneous generation

As Brian Eno sang on Before and After Science,

“If you study the logistics
and heuristics of the mystics
you will find that their minds rarely move in a line.”1

This aphorism comes to mind when considering the massive roadways that snake through the should-be-walkable suburban retrofits. The plans of the traffic engineers follow a curious logic indeed.

In his book Paved Paradise, Henry Grabar highlighted an assumption deeply embedded in North American traffic engineering. He discusses the Parking Generation Manual published in 1985 by the Institute of Traffic Engineers. Underpinning the nearly infinite specifications for required parking, Grabar says, “the premise is simple: every type of building creates car trips, and projects should be approved, streets designed, and parking constructed according to the science of trip generation.”2

The belief that a building itself somehow generates traffic, and a multi-unit building generates multi-traffic, guides not only parking requirements but also roadway planning. In this thinking, it is not a car-dependent lifestyle or urban layout that generates traffic, it is the mere existence of buildings where people live, work, or shop. As long as this thinking guides traffic engineers, urban planners’ hopes for dense, walkable districts get sidetracked.

In the Uptown Core project in Oakville, Ontario, Cleveland writes,

“Traffic studies … predicted the community would have high traffic demand, requiring wide roads throughout the community. Studies predicted high traffic, ironically, precisely because the community was dense: traffic models assume each unit produces a certain number of traffic trips, regardless of whether the community is designed to be walkable or not.” (pg 203)

Tysons, Virginia is the largest and most famous suburban retrofit project in North America. As a classic “edge city,” Tysons in 1993 had few homes but a forest of high-rise office buildings where 70,000 people worked. The only way to get to these buildings was by car. Two examples of “inverse feedback” helped to prompt a retrofit: prime development land was getting scarce, and roads choked with traffic were undermining the original locational advantage for this mega office park.

Following a wave of investment in high-density housing, the population of Tysons rose to 29,000 by 2021, of which 10,000 lived in transit-oriented developments near the new Silver Line commuter rail service to Washington, DC.

But the planning for a walkable district had to contend with traffic engineers at the county and state level. They insisted that, ideals of walkability notwithstanding, Tysons would need to accommodate ever greater numbers of private vehicles. As a result, “Tysons’ smaller collectors and minor avenues are larger than the widest highways in many cities, at seven to ten lanes.” (pg 166)

Multi-lane highways even run directly past the commuter rail stations, making it unattractive or impossible to build new developments in close proximity to the stations. Ringed and bisected by high-speed, high-volume, high-pollution, very wide roads, Tysons can be summarized as “islands of walkability amidst rivers of car-dependence,” Cleveland writes. (pg 151)

Intercurrence in Tysons is reflected in government expenditures that work at cross-purposes:

“I am aware of few examples where government has spent so heavily to achieve a goal while spending so heavily to undermine it: billions of dollars on subways, sidewalks, and bike lanes, and nearly a billion dollars for widening roads and onramps, and billions more on widening its highways.” (pg 193)

Another lesson to be drawn is that “if it is difficult to shift one path-dependent institution, it is more difficult to shift two simultaneously, Cleveland writes. “Multilevel governance can therefore create additional barriers to change, reducing the likelihood that all relevant institutions will shift to support walkability simultaneously.” (pg 180)

An all-or-nothing proposition?

Because the factors reinforcing suburban car-dependency are many and strong, and most suburban retrofits have had limited success to date, some urbanists have concluded that incremental approaches are doomed to failure.

Cleveland cites various authors who “argue it is better for a single developer to own enough land to build a full-scale walkable community at once, establishing a critical mass of dense housing, pedestrian-friendly streets, and high-quality public spaces, all within walking distance of local shops and services.” (pg 230)

But Cleveland concludes (correctly, I believe), that

“It is important for cities to learn how to implement incremental retrofits, because cities cannot achieve their most urgent goals by retrofitting those few exceptional sites where government owns a former airport, military base, or other large piece of land, and can redevelop it all at once.” (pg 230)

In a coming post we’ll look further at possibilities for incremental change toward walkable suburbs, including changes that are undertaken not by governments but directly by residents.


Photo at top of post: “Express Lanes at Tysons Corner ”, photograph by Trevor Wrayton for Virginia Department of Transportation, licensed by Creative Commons. accessed via flickr.


Notes

1   From the song “Backwater” on the album Before and After Science by Brian Eno, 1977.

2   Henry Grabar, Paved Paradise, Penguin Random House, 2023; pg 153.

Building car-dependent neighbourhoods

Also published on Resilience

Car-dependent neighbourhoods arise in a multi-level framework of planning, subsidies, advertising campaigns and cultural choices. After that, car dependency requires little further encouragement. Residents are mostly “locked-in”, since possible alternatives to car transport are either dangerous, unpleasant, time-consuming, or all three.

At the same time, municipal officials have strong incentives to simply accept car dependency – it takes bold new thinking to retrofit such neighbourhoods. Voters are likely to resist such new directions, since it is hard for them to imagine making their daily rounds using anything except private cars.

This post continues a discussion of what car dependency looks like on the map. The previous installment looked at car dependency on a regional scale, while this one looks at the neighbourhood scale.

Both posts use examples from Durham Region, a large administrative district on the east flank of Toronto. With a current population of about 700,000, Durham Region is rapidly suburbanizing.

I’ve picked one neighbourhood to illustrate some common characteristics of car-dependent sprawl. I have chosen not to name the neighbourhood, since the point is not to single out any specific locale. The key features discussed below can be seen in recent suburban developments throughout Durham Region, elsewhere in Ontario, and around North America.

Let’s begin to zoom in. In the aerial view below you can see new subdivisions creeping out towards a new expressway. Brown swatches represent farmland recently stripped of topsoil as the first step in transforming rich agricultural land into suburban “development”. (In the short time since this aerial imagery was obtained, the brown swatches have become noticeably more extensive.)

The neighbourhood we’ll focus on includes a high school, conveniently identifiable by its distinctive oval running track.

Subdivisions here are built in a megablock layout, with the large-scale grid intended to handle most of the traffic. Within each megablock is a maze of winding roads and lots of dead-ends. The idea is to discourage through traffic on residential streets, but this street pattern has many additional consequences.

First, from the centre of one megablock to the centre of another nearby megablock, there is seldom a direct and convenient route. A trip that might be a quarter of a kilometer as the crow flies might be a kilometer or two as the car drives. In the worst areas, there are no available short cuts for cyclists or pedestrians either.

Second, the arterial roads need to be multilane to cope with all the traffic they collect – and as “development” proceeds around them they are soon overwhelmed. “Recovering engineer” Charles Marohn explains this phenomenon using an analogy from hydrology. At a time of heavy rain, a whole bunch of little streams feed into progressively larger streams, which soon fill to capacity. With a pattern of “collector” roads emptying into secondary arterial roads into primary arterials and then into expressways, suburban road systems manage to engineer traffic “floods” each time there is a “heavy rain” – that is, each morning and afternoon at rush hour.1

As we zoom in to our high school’s neighbourhood, note another pattern repeated throughout this region. Within a residential neighbourhood there may be a row of houses close to and facing an arterial road. Yet these houses are on the equivalent of a “service road” rather than having direct access to the arterial. For motorists living here the first stage of a journey, to the arterial road just 50 meters from their driveway, requires driving ten times that far before their journey can really begin. Though the maze pattern is intended to limit traffic in such neighborhoods, residents create a lot of traffic simply to escape the maze.

The residential service road pattern has the effect of making arterial roads into semi-controlled-access roads. As seen in this example, there are few driveways or other vehicle entry points in long straight stretches of such an arterial. This design encourages drivers to drive well above the posted 60 km/hr speed limit … whenever the road is not clogged with rush-hour traffic, that is.

High traffic speeds make crossing such roads a dangerous undertaking for pedestrians and cyclists. True, there are some widely-spaced authorized crossing points, with long waits for the “walk” light. But when getting to and waiting at a crosswalk is not convenient, some people will predictably take their chances fording the rushing stream at other points. How many parents will encourage or even allow their children to walk to school, a playground, or a friend’s house if the trip involves crossing roads like these?

Just across the road. High school is on the left of the road, residential neighbourhood to the right.

Pedestrian access is at best a secondary consideration in such developments. Consider the aerial view below.

Directly across one arterial road from the high school, and across another arterial from a residential neighbourhood, is a cluster of big box retail stores including a Walmart Supercentre. The Walmart has 200 meters of frontage on the street, but in that stretch there is no entrance, nothing but concrete wall to greet the occasional lonesome pedestrian.

From another direction, many people live “just across the street” from the Walmart and other stores. Except … would-be pedestrian shoppers will need to cross not just a multilane urban highway, but also hectares of parking lot, before reaching the doors of a store. These stores are large in retail floor area, but they are dwarfed by the land given to parking. In accord with minimum parking requirements, the stores have spent hundreds of thousands of dollars to provide “free parking”. But there is no requirement to take the convenience of pedestrians into account. The doors open to the parking lots, not to the streets, because the vast majority of shoppers will arrive in large private vehicles that will need to be stored somewhere while the owner goes shopping.

Nevertheless there will be a small minority in such neighbourhoods who get to the store on foot or on bike. A few might be brave, stubborn environmentalists or exercise freaks. But mostly they will be people who can’t afford a car, or who can’t drive because of some type or degree of disability. Disproportionately, they will be elderly and/or in poor health. Particularly when carrying heavy bags of groceries, they will not want to go far out of their way to get to a crosswalk, preferring instead to make the shortest straightest trip home. It is not an accident that high-volume arterial roads in suburbs account for a large proportion of pedestrian deaths in North American cities. It is not an accident, either, that a disproportionate number of these deaths are inflicted on elderly, disabled, poor, or racially disadvantaged pedestrians.2

Lamp posts

Out beyond the beyond

It is now widely recognized that car-dependent suburbia hurts public health via an increase in diseases of sedentary lifestyle and due to the stress of spending many hours a week in alternately frenetic and creeping traffic.3 The environmental costs of sprawl include high carbon emissions, impermeable ground covering that rapidly flushes polluted run-off into diminishing areas of creeks and wetlands, and urban heat-island effects from so much concrete and asphalt. Particularly in Ontario, new tracts of car-dependent sprawl can only be built with the sacrifice of increasingly scarce class one farmland.4 Finally, groups such as Strong Towns have documented the long-term fiscal disaster of suburban development.5 Even though higher levels of government typically pay much of the initial cost of major infrastructure, municipalities will be on the hook for maintenance and eventual rebuilding – and property taxes in low-density suburbs seldom bring in enough revenue to cover these steadily accruing liabilities.

Yet in Ontario the large property developer lobby remains as strong a political force as ever. The Premier of Ontario makes no real attempt to hide his allegiance to the largest property developers.6 In Durham Region, after a long public consultation process recommended intensification of existing urban areas to accommodate growing populations, politicians suddenly voted instead for a sprawl-expanding proposal put forward by the development industry lobby.7

So in 2023, corn fields and pastures beyond the current edge of suburbia are being bulldozed, new maze-like streets laid out, thousands of big, cheaply-made, dearly-purchased, cookie-cutter houses stuffed into small lots. For a brief period new residents can look through the construction dust and see nearby farmland or woodland – until the edge of suburbia takes the next step outward.

Suppose you believe, as I do, that this ruinous pattern of development should not and cannot last – that this pattern will not survive past the era of cheap energy, and will not survive when its long-term fiscal non-sustainability results in collapsing services and municipal bankruptcies. When car culture sputters, falters and runs off the road, can these thousands of neighbourhoods, home to millions of people, be transformed so they are no longer car dependent? That’s a big question, but the next post will offer a few ideas.

For today, the edge


Image at top of page: Bulldozertown (click here for full-screen image). All photos used here are taken in the same area shown in satellite views.


Notes

Charles Marohn, Confessions of a Recovering Engineer, Wiley, 2021; pages 85–87.

For analyses of trends in pedestrian deaths, see Angie Schmitt’s 2020 book Right of Way (reviewed here), and Jessie Singer’s 2022 book There Are No Accidents (reviewed here).

See “Suburbs increasingly view their auto-centric sprawl as a health hazard,” by Katherine Shaver, Washington Post, December 28, 2016.

“Ontario losing 319 acres of farmland every day,” Ontario Farmland Trust, July 4, 2022.

See “The Growth Ponzi Scheme: A Crash Course,” by John Pattison, strongtowns.org.

See The Narwhal, “Six developers bought Greenbelt land after Ford came to power. Now, they stand to profit,” November 17, 2022; BlogTO, “All the crazy details about Doug Ford’s controversial stag and doe party with developers,” February 9, 2023.

See The Narwhal, “Ontario’s Durham Region approves developer-endorsed plan to open 9,000 acres of farmland,” May 26, 2022.

How parking ate North American cities

Also published on Resilience

Forty-odd years ago when I moved from a small village to a big city, I got a lesson in urbanism from a cat who loved to roam. Navigating the streets late at night, he moved mostly under parked cars or in their shadows, intently watching and listening before quickly crossing an open lane of pavement. Parked cars helped him avoid many frightening hazards, including the horrible danger of cars that weren’t parked.

The lesson I learned was simple but naïve: the only good car is a parked car.

Yet as Henry Grabar’s new book makes abundantly clear, parking is far from a benign side-effect of car culture.

The consequences of car parking include the atrophy of many inner-city communities; a crisis of affordable housing; environmental damages including but not limited to greenhouse gas emissions; and the continued incentivization of suburban sprawl.

Paved Paradise is published by Penguin Random House, May 9, 2023

Grabar’s book is titled Paved Paradise: How Parking Explains the World. The subtitle is slightly hyperbolic, but Grabar writes that “I have been reporting on cities for more than a decade, and I have never seen another subject that is simultaneously so integral to the way things work and so overlooked.”

He illustrates his theme with stories from across the US, from New York to Los Angeles, from Chicago to Charlotte to Corvallis.

Paved Paradise is as entertaining as it is enlightening, and it should help ensure that parking starts to get the attention it deserves.

Consider these data points:

  • “By square footage, there is more housing for each car in the United States than there is housing for each person.” (page 71; all quotes in this article are from Paved Paradise)
  • “The parking scholar Todd Litman estimates it costs $4,400 to supply parking for each vehicle for a year, with drivers directly contributing just 20 percent of that – mostly in the form of mortgage payments on a home garage.” (p 81)
  • “Many American downtowns, such as Little Rock, Newport News, Buffalo, and Topeka, have more land devoted to parking than to buildings.” (p 75)
  • Parking scholar Donald Shoup estimated that in 1998, “there existed $12,000 in parking for every one of the country’s 208 million cars. Because of depreciation, the average value of each of those vehicles was just $5,500 …. Therefore, Shoup concluded, the parking stock cost twice as much as the actual vehicles themselves. (p 150)

How did American cities come to devote vast amounts of valuable real estate to car storage? Grabar goes back to basics: “Every trip must begin and end with a parking space ….” A driver needs a parking space at home, and another one at work, another one at the grocery store, and another one at the movie theatre. There are six times as many parking spaces in the US as there are cars, and the multiple is much higher in some cities.

This isn’t a crippling problem in sparsely populated areas – but most Americans live or work or shop in relatively crowded areas. As cars became the dominant mode of transportation the “parking problem” became an obsession. It took another 60 or 70 years for many urban planners to reluctantly conclude that the parking problem can not be solved by building more parking spaces.

By the dawn of the twenty-first century parking had eaten American cities. (And though Grabar limits his story to the US, parking has eaten Canadian cities too.)

Grabar found that “Just one in five cities zoned for parking in 1950. By 1970, 95 percent of U.S. cities with over twenty-five thousand people had made the parking spot as legally indispensable as the front door.” (p 69)

The Institute of Transportation Engineers theorized that every building “generated traffic”, and therefore every type of building should be required to provide at least a specified number of parking spaces. So-called “parking minimums” became a standard feature of the urban planning rulebook, with wide-ranging and long-lasting consequences.

Previously common building types could no longer be built in most areas of most American cities:

“Parking requirements helped trigger an extinction-level event for bite-size, infill apartment buildings …; the production of buildings with two to four units fell more than 90 percent between 1971 and 2021.” (p 180)

On a small lot, even if a duplex or quadplex was theoretically permitted, the required parking would eat up too much space or require the construction of unaffordable underground parking.

Commercial construction, too, was inexorably bent to the will of the parking god:

“Fast-food architecture – low-slung, compact structures on huge lots – is really the architecture of parking requirements. Buildings that repel each other like magnets of the same pole.” (p 181)

While suburban development was subsidized through vast expenditures on highways and multi-lane arterial roads, parking minimums were hollowing out urban cores. New retail developments and office complexes moved to urban edges where big tracts of land could be affordably devoted to “free” parking.

Coupled with separated land use rules – keeping workplaces away from residential or retail areas – parking minimums resulted in sprawling development. Fewer Americans lived within safe walking or cycling distance from work, school or stores. Since few people had a good alternative to driving, there needed to be lots of parking. Since new developments needed lots of extra land for that parking, they had to be built further apart – making people even more car-dependent.

As Grabar explains, the almost universal application of parking minimums does not indicate that there is no market for real estate with little or no parking. To the contrary, the combination of high demand and minimal supply means that neighbourhoods offering escape from car-dependency are priced out of reach of most Americans:

“The most expensive places to live in the country were, by and large, densely populated and walkable neighborhoods. If the market was sending a signal for more of anything, it was that.” (p 281)

Is the solution the elimination of minimum parking requirements? In some cases that has succeeded – but reversing a 70- or 80-year-old development pattern has proven more difficult in other areas. 

Resident parking on Wellington Street, South End, Boston, Massachusetts. Photo by Billy Wilson, September 2022, licensed through Creative Commons BY-NC 2.0, accessed at Flickr.

The high cost of free parking

Paved Paradise acknowledges an enormous debt to the work of UCLA professor Donald Shoup. Published in 2005, Shoup’s 773-page book The High Cost of Free Parking continues to make waves.

As Grabar explains, Shoup “rode his bicycle to work each day through the streets of Los Angeles,” and he “had the cutting perspective of an anthropologist in a foreign land.” (p 149)

While Americans get exercised about the high price they occasionally pay for parking, in fact most people park most of the time for “free.” Their parking space is paid for by tax dollars, or by store owners, or by landlords. Most of the cost of parking is shared between those who drive all the time and those who seldom or never use a car.

By Shoup’s calculations, “the annual American subsidy to parking was in the hundreds of billions of dollars.” Whether or not you had a car,

“You paid [for the parking subsidy] in the rent, in the check at the restaurant, in the collection box at church. It was hidden on your receipt from Foot Locker and buried in your local tax bill. You paid for parking with every breath of dirty air, in the flood damage from the rain that ran off the fields of asphalt, in the higher electricity bills from running an air conditioner through the urban heat-island effect, in the vanishing natural land on the outskirts of the city. But you almost never paid for it when you parked your car ….” (p 150)

Shoup’s book hit a nerve. Soon passionate “Shoupistas” were addressing city councils across the country. Some cities moved toward charging market prices for the valuable public real estate devoted to private car storage. Many cities also started to remove parking minimums from zoning codes, and some cities established parking maximums – upper limits on the number of parking spaces a developer was allowed to build.

In some cases the removal of parking minimums has had immediate positive effects. Los Angeles became a pioneer in doing away with parking minimums. A 2010 survey looked at downtown LA projects constructed following the removal of parking requirements. Without exception, Grabar writes, these projects “had constructed fewer parking spaces than would have been required by [the old] law. Developers built what buyers and renters wanted ….” (p 193) Projects which simply wouldn’t have been built under old parking rules came to market, offering buyers and tenants a range of more affordable options.

In other cities, though, the long habit of car-dependency was more tenacious. Grabar writes:

“Starting around 2015, parking minimums began to fall in city after city. But for every downtown LA, where parking-free architecture burst forth, there was another place where changing the law hadn’t changed much at all.” (p 213)

In neighbourhoods with few stores or employment prospects within a walking or cycling radius, and in cities with poor public transit, there remains a weak market for buildings with little or no parking. After generations of heavily subsidized, zoning-incentivized car-dependency,

“There were only so many American neighborhoods that even had the bones to support a car-free life …. Parking minimums were not the only thing standing between the status quo and the revival of vibrant, walkable cities.” (p 214)

There are many strands to car culture: streets that are unsafe for people outside a heavy armoured box; an acute shortage of affordable housing except at the far edges of cities; public transit that is non-existent or so infrequent that it can’t compete with driving; residential neighbourhoods that fail to provide work, shopping, or education opportunities close by. All of these factors, along with the historical provision of heavily subsidized parking, must be changed in tandem if we want safe, affordable, environmentally sustainable cities.

Though it is an exaggeration to say “parking explains the world”, Grabar makes it clear that you can’t explain the world of American cities without looking at parking.

In the meantime, sometimes it works to use parked cars to promote car-free ways of getting around. Grabar writes,

“One of [Janette] Sadik-Khan’s first steps as transportation commissioner was taking a trip to Copenhagen, where she borrowed an idea for New York: use the parked cars to protect the bike riders. By putting the bike lanes between the sidewalk and the parking lane, you had an instant wall between cyclists and speeding traffic. Cycling boomed; injuries fell ….” (p 256)

A street-wise cat I knew forty years ago would have understood.


Photo at top of page: Surface parking lot adjacent to Minneapolis Armory, adapted from photo by Zach Korb, August 2006. Licensed via Creative Commons BY-NC-2.0, accessed via Flickr. Part of his 116-photo series “Downtown Minneapolis Parking.”

Lost in traffic: does your time count?

Also published on Resilience

Traffic congestion studies make for quick and easy news articles, but they don’t even begin to calculate the true time lost to car culture.

The news story practically wrote itself: Toronto was ranked 7th worst among world cities for traffic congestion in 2022.

A web search showed similar stories popping up all over: “________________ [nearby city] ranks __th worst in world for traffic congestion.”

What did these traffic congestion ratings really measure? That wasn’t usually spelled out in click-bait articles. But a closer look reveals that the ratings measure and value the time spent by one particular class of urban residents – drivers – while omitting the urban mobility costs born by other citizens.

The basis for the recent round of stories was an annual report by INRIX called 2022 INRIX Global Traffic Scorecard. The company describes their work this way:

“INRIX Research uses INRIX proprietary big data, analytics and industry expertise to understand the movement of people and goods around the world. We achieve this by leveraging billions of anonymous data points every day from a diverse set of sources on all roads in countries of coverage. Our data provides a rich and fertile picture of mobility that enables INRIX Research to produce valuable and actionable insights for policy makers, transport professionals, automakers, and drivers.” (2022 INRIX Global Traffic Scorecard, page 27)

The Traffic Scorecard makes brief mentions of transportation methods such as walking, biking and public transit. But these ways of getting around cities don’t count in the Global Traffic Scorecard – even for cities in which they are the dominant types of mobility.

Instead, the Scorecard tallies and values the time supposedly lost by a particular subset of travelers, which happens to include most policymakers, politicians, the upper ranks of media, and mid- and upper-level businesspeople – that is, those who get around cities routinely by car.

For this class of people, an unobtainable ideal is a key factor in calculating the cost of lost time: the standard of “free-flow conditions.” This is the idea that when a large number of drivers are stalled in slow traffic, each one should imagine how fast they could move if most or all of the other drivers were not on the road; then there would be “free-flow conditions.”

It is nonsensical to imagine that in rush hour in a big city, when most people are commuting all at once, you could ever achieve “free-flow conditions”. Nevertheless this ideal is used as the measuring stick for calculating “time lost in traffic”. As INRIX explains their calculations,

“Total time lost is the difference in travel times experienced during the peak periods compared to free-flow conditions on a per driver basis. In other words it is the difference between driving during commute hours versus driving at night with little traffic.” (p. 10)

Using this standard, INRIX calculates that “The typical US driver lost 51 hours due to congestion in 2022.” In the UK, the typical driver lost 80 hours, and in Germany it was 40 hours.

What is this time “worth”? Using figures from the US Federal Highway Administration, INRIX calculates each hour of time lost in traffic as valued at $16.89 in the US, £8.83 in the U.K., and 10.08€ in Germany. Given the numbers of hours lost by each driver, and the large number of drivers, you can come up with large monetary sums for the cost of congestion. INRIX states that traffic congestion cost the US, for example, $81 billion in 2022. These sums will be bandied about whenever lobbyists advocate for more billions to be spent on road widening projects.

Consider the above excerpt from the INRIX report. The seven “most congested” cities all have substantial, sometimes world-famous public transit systems, and all have a substantial portion of population who don’t own or commute in cars.

How does “traffic congestion” affect all the people who don’t drive but still need to get around? Are they less affected by congestion than those poor, benighted drivers? Or are they even more affected? INRIX doesn’t tell us.

Yet in the number one city for congestion, London, only a minority own a car and a much smaller minority use a car for commuting:

“New census data has revealed that just 20 per cent of Londoners commute by car and 41 per cent of London households have no car at all. Yet despite this relatively low level of car ownership, the city is disproportionately designed to incentivise driving. At nearly 20,000 hectares, 12.4 per cent of land in the capital is taken up by roads – significantly more than the just 8.8 per cent of London currently used for housing.” (Dezeen, “Cities should not just build green transport but actively dismantle car infrastructure”, by Phineas Harper, 11 January 2020)

Statistics are similar for New York City: about 45 percent of households own a car, though fewer use cars to commute. (Source: NYCEDC) Even in Toronto, now dominated by its sprawling suburbs, about 28% of households do not own a car, and in some parts of the city non-car-owners are the majority. (Source: Toronto Star)

Do the non-car-users lose as much time to traffic congestion? For people who live close enough to workplaces or schools to walk or to bike, they might well lose much less time in traffic than the average car commuter (though they may still pay a high price in breathing polluted air, while risking being crushed by cars and trucks on unsafe roads).

But one thing is clear: the time lost by non-car-users is neither counted nor valued in congestion surveys like INRIX’s. And when policymakers make important transportation systems decisions based on surveys like INRIX’s you can expect the results to be seriously flawed.

The Gardiner Expressway walls off Toronto from its waterfront on Lake Ontario, and has required ever more costly repairs. In 2021 the Toronto Star reported “The Gardiner will eat up $2 billion of the 2021-2030 capital plan — 38 per cent of total transportation-related infrastructure spending — meaning the city will spend as much rehabilitating the Gardiner as they will on upkeep on every other roadway.”  But a study commissioned by the Gardiner Coalition found that removing the eastern portion of the expressway could add 5 to 10 minutes to the commute times of rush-hour drivers –  so the elevated expressway is still eating big chunks of the city’s budget. Photo by George Socka, from Wikimedia Commons.

Arriving at a good estimate of the time non-drivers lose to traffic congestion is difficult, but that doesn’t make the losses any less real. Take, for example, all the time pedestrians spend waiting at traffic lights while autos either speed or crawl through intersections. Think of the extra time pedestrians must spend walking out of their way to get to a relatively safe place to cross a busy road, and then doubling back to their destination. Think of the time public transit users must wait while their packed buses or trams are stalled behind private cars which each carry one person.

The Jane M. Byrne Interchange of expressways I90, I94 and I294, takes a big chunk of downtown Chicago, eating up a lot of time for non-car-drivers who need to get from one side of the tangle to another. Photo by Sea Cow, April 2022, from Wikimedia Commons.

Other lost-time costs of car culture are even harder to calculate. In many cities where car culture has hegemony, large swathes of urban landscape have been cleared and turned into car lanes plus necessary storage space, i.e. parking. That pushes actual destinations – homes, stores, schools, workplaces – farther apart. The resulting greater travel distances cost everyone more travel time. But above all the people who don’t drive, but still need to get around, lose a lot of their time in getting past expressways, multi-lane arterial roads, and parking lots on the way to their destinations. Traffic congestion studies don’t even begin to quantify the time lost to all this “induced distance”.

Studies like INRIX’s scorecard make for quotable listicles and reverse-bragging rights among the driving class. But beware when this skewed data is put forth as a basis for public policy decisions on transportation infrastructure.


Photo at top of page: Waiting for the lights, Sydney, Australia, photo by Dave Young, license under Creative Commons 2.0, at flickr.com.

Right-sizing delivery vehicles

Cargo bikes can replace far heavier vehicles for a substantial share of urban deliveries. But should you buy a cargo bike for personal use? Probably not.

ALSO PUBLISHED ON RESILIENCE.ORG

In North America we think in extreme terms when it comes to last-mile freight delivery. Whether the cargo is a couple of bags of groceries, a small parcel, a large-screen TV or a small load of lumber, we routinely dispatch vehicles with hundreds-of-horsepower engines.

This practice has never made sense, and there have always been niche markets where some products and parcels have been delivered by bicycle couriers instead of truck drivers. Historically, cargo bikes were in wide use in many cities in the decades before cars and trucks cemented their death grip on most urban traffic lanes.1

Today the cargo bike industry is growing rapidly due to several factors. Many cities are establishing zero-emissions zones. The cost of gasoline and diesel fuel has risen rapidly. Congested traffic means powerful expensive vehicles typically travel at bicycle-speed or slower in downtown areas. Last but not least, the development of low-cost, lightweight electric motors for small vehicles dramatically boosts the freight delivery capacity of e-assist bikes even in hilly cities.

Thousands of companies, from sole-proprietor outfits to multinational corporations, are now integrating cargo bikes into their operations. At the same time there is an explosion of new micro-powered vehicle designs on the market.2

Where a diesel-powered urban delivery van will have an engine with hundreds of horsepower, an electric-assist bike in the EU is limited to a motor of 250 W, or about one-third of one horsepower.3 Yet that small electric motor is enough to help a cyclist make typical parcel deliveries in many urban areas at a faster rate than the diesel van can manage.

A great many other deliveries are made, not by companies, but simply by individuals bringing their own purchases home from stores. In this category, too, North Americans tend to believe an SUV or pick-up truck is the obvious tool for the job. But in many car-clogged cities and suburbs a bicycle, whether electric-assist or not, is a much more appropriate tool for carrying purchases home from the store.

Image from pxhere.com, licensed via CC0 Public Domain.

This is an example of a change that can be made at the device level, rapidly, without waiting for system-level changes that will take a good bit longer. When it comes to reducing carbon emissions and reducing overall energy use, the rapid introduction and promotion of cargo bikes as delivery vehicles is an obvious place to make quick progress.

At the same time, the adoption of more appropriate delivery devices will become much more widespread if we simultaneously work on system-level changes. These changes can include establishing more and larger urban zero-emission zones; lowering speed limits for heavy vehicles (cars and trucks) on city streets; and rapid establishment of safe travel lanes for bikes throughout urban areas.

The environmental impact of deliveries

The exponential growth in online shopping over the past twenty years has also led to “the constant rise in the use of light commercial vehicles, despite every effort by cities and regulators to reduce congestion and transport emissions.”4

Last-mile urban delivery, notes the New York Times, “is the most expensive, least efficient and most impactful part of the supply chain.”5

Typical urban parcel delivery trucks have an outsize impact:

“Claudia Adriazola-Steil, acting director of the Urban Mobility Program at the World Resources Institute’s Ross Center for Sustainable Cities, said freight represented 15 percent of the vehicles on the roads in urban areas, but occupied 40 percent of the space. ‘They also emit 50 percent of greenhouse gas emissions and account for 25 percent of fatalities ….’”6

Since vehicle speeds in downtown areas are typically slow, most parcels are not very heavy, and the ability to travel in lanes narrower than a typical truck is a great advantage, a substantial portion of this last-mile delivery can be done by cargo bikes.

Both Fed-Ex and UPS are now building out electric-assist cargo bike fleets in many Western European cities. UPS has also announced plans to test electric-assist cycles in Manhattan.7

How much of the last-mile delivery business can be filled by cargo bikes? A report by the Rapid Transition Alliance says that “In London, it’s estimated that up to 14% of small van journeys in the most congested parts of the city could be made with cargo bikes.”8 City Changer Cargo Bike estimates that in Europe “up to 50% of urban delivery and service trips could be replaced by cargo bikes….”9

It’s important to note that big corporations aren’t the only, or even the major, players in this movement. Small businesses of every sort – ice-cream vendors, bakeries, self-employed carpenters and plumbers, corner grocery stores – are also turning to cargo bikes. The City Changer Cargo Bike report says that “It is important to highlight that the jobs created by cargo bikes are mainly created by Small and Medium-size Enterprises.”10

For small companies or large, the low cost of cargo bikes compared to delivery vans is a compelling factor. The New York Times cites estimates that “financial benefits to businesses range from 70-90% cost savings compared to reliance on delivery vans.”11

The cost savings come not only from the low initial purchase price and low operating costs of cargo bikes, but also from the fact that “electric cargo bikes delivered goods 60 percent faster than vans did in urban centers, and that an electric cargo bike dropped off 10 parcels an hour compared with a van’s six.”12

It’s no wonder the cargo bike industry is experiencing rapid growth. Kevin Mayne of Cycling Industries Europe says sales are growing at 60% per year across the European Union and could reach 2 million cargo bike sales per year by 2030.

Delivery vans in European cities are typically powered by diesel. Replacing a few hundred thousand diesel delivery vans with e-cargo bikes will obviously have a significant positive impact on both urban air quality and carbon emissions.

But what if diesel delivery vans are switched instead to similar-sized electric delivery vans? Does that make the urban delivery business environmentally benign?

Far from it. Electric delivery vans are just as heavy as their diesel counterparts. That means they cause just as much wear and tear on city streets, they pose just as much collision danger to cyclists, pedestrians, and people in smaller vehicles, and they produce just as much toxic tire and brake dust.

Finally, there is the significant impact of mining and manufacturing all that vehicle weight, in terms of upfront carbon emissions and many other environmental ills. There are environmental costs in manufacturing cargo bikes too, of course. But whereas a delivery van represents a large amount of weight for a much smaller delivery payload, a cargo bike is a small amount of weight for a relatively large payload.

In a listing by Merchants Fleet of the “5 Best Electric Cargo Vans for Professionals”, all the vehicles have an empty-weight a good bit higher than the maximum weight of cargo they can carry. (The ratios of empty vehicle weight to maximum cargo weight range from about 1.5 to 3.5.)13

By contrast, a recent list of recommended electric-assist cargo bikes shows that the ratios are flipped: all of these vehicles can carry a lot more cargo than the vehicles themselves weigh, with most in the 4 – 5 times cargo-weight-to-empty-vehicle-weight range.14

One other factor is particularly worthy of note. The lithium which is a key ingredient of current electric-vehicle batteries is difficult, perhaps impossible, to mine and refine in an environmentally benign way. Lithium batteries will be in extremely high demand if we are to “electrify everything” while also ramping up storage of renewably, intermittently generated electricity. Given these constraints, shouldn’t we take care to use lithium batteries in the most efficient ways?

Let’s look at two contrasting examples. An Urban Arrow Cargo bike has a load capacity of 249 kg (550 lbs), and a battery weight of 2.6 kg (5.7 lbs)15 – a payload-to-battery-weight ratio of about 44.

The Arrival H3L3 electric van has a load capacity of 1484 kg (3272 lbs) and its battery is rated at 111 kWh.16 If we assume, generously, that the Arrival’s battery weighs roughly the same as Tesla’s 100 kWh battery, then the battery weight is 625 kg (1377 lbs).17 The Arrival then has a payload-to-battery-weight ratio of about 2.4.

In this set of examples, the e-cargo bike has a payload-to-battery-weight ratio almost 20 times as high as the ratio for the e-cargo van.

Clearly, this ratio is just one of many factors to consider. The typical e-cargo van can carry far heavier loads, at much higher speeds, and with a longer range between charges, than e-cargo bike can manage. But for millions of urban last-mile deliveries, these theoretical advantages of e-cargo vans are of little or no practical value. In congested urban areas where travel speeds are low, daily routes are short, and for deliveries in the 1 – 200 kg weight range, the e-cargo bike can be a perfectly adequate device with a small fraction of the financial and environmental costs of e-cargo vans.

On Dundas Street, Toronto, 2018.

Cargo bikes, or just bikes that carry cargo?

A rapid rollout of cargo bikes in relatively dense urban areas is an obvious step towards sustainability. But should you buy a cargo bike for personal use?

Probably not, in my opinion – though there will be many exceptions. Here is why I think cargo bikes are overkill for an average person.

Most importantly, the bikes most of us have been familiar with for decades are already a very good device for carrying small amounts of cargo, particularly with simple add-ons such as a rack and/or front baskets.

A speed fetish was long promoted by many bike retailers, according to which a “real bike” was as light as possible and was ridden by a MAMIL – Middle-Aged Male In Lycra – who carried nothing heavier than a credit car. Cargo bikes can represent a chance for retailers to swing the pendulum to the opposite extreme, promoting the new category as a necessity for anyone who might want to carry more than a loaf of bread.

In spite of bike-industry biases, countless people have always used their bikes – any bikes – in routine shopping tasks. And with the addition of a sturdy cargo rack and a set of saddlebags, aka panniers, a standard-form bike can easily carry 25 kg or more of groceries. Or hardware, or gardening supplies, or a laptop computer and set of office clothes, or a stack of university textbooks.

The bikes now designed and marketed as cargo bikes can typically carry several times as much weight, to be sure. But how often do you need that capability, and is it worth the considerable downside that comes with cargo bikes?

Cargo bikes are typically a good bit longer and a lot heavier than standard-model bikes. That makes them more complicated to store. You probably won’t be able to carry a big cargo bike up stairs to an apartment, and you might not sleep well if you have to leave an expensive cargo bike locked on the street.

If you only occasionally need to carry larger amounts of cargo, you’re likely to get tired of riding a needlessly heavy and bulky bike the rest of the time.

If you occasionally carry your bike on a bus, train, or on a rack behind a car, a long cargo bike may be difficult or impossible to transport the same way.

Depending on the form factor, you may find a cargo bike doesn’t handle well in spite of its large weight capacity. Long-tail cargo bikes, with an extra-long rack over the rear wheel, can carry a lot of weight when that weight is distributed evenly on both sides of the rack. But if the load is a single heavy object, you may find it difficult to strap the load on the top of the rear rack so that it doesn’t topple bike and rider to one side or the other. (As one who has tried to load a big reclining chair onto a rear rack and ride down the road, I can attest that it’s harder than it sounds.)

Long-tail cargo bike. Photo by Richard Masoner on flickr.com, licensed via Creative Commons 2.0.


Box-style cargo bike in Lublin, Poland. Photo by Porozumienie Rowerowe, “Community cargo rental”, via Wikimedia Commons.

The large box style cargo bikes known as bakfiets solve those balance problems, but are typically heavy, long, and thus difficult to store. They can be ideal for moving around a city with children, though many parents will not feel comfortable doing so unless there is a great network of safe streets and protected bike lanes.

For people who have a secure storage space such as a garage, and the budget to own more than one bike, and for whom it will often be helpful to be able to carry loads of 100 kg or more by bike – a cargo bike might be a great buy. Or, perhaps a cargo trailer will be more practical, since it can add great cargo-carrying ability to an ordinary bike on an as-needed basis.18

Ideally, though, every urban area will soon have a good range of cargo-bike businesses, and some of those businesses will rent or loan cargo bikes to the rest of us who just occasionally need that extra capacity.

• • •

In the next installment of this series on transportation, we’ll look at a sector in which no significant device-level fixes are on the horizon.


References

See A Visual History of the Cargo Bike, from Mechanic Cycling, Haverford, Pennsylvania.

For an overview of a wide range of new cargo bikes and urban delivery initiatives, see the annual magazine of the International Cargo Bike Festival.

In North America wattage restrictions vary but many jurisdictions allow e-assist bikes with motors up to 750 Watt output.

Stakeholder’s Guide: Expanding the reach of cargo bikes in Europe, published by CycleLogistics and City Changer Cargo Bike, 2022.

“A Bicycle Built for Transporting Cargo Takes Off,” by Tanya Mohn, New York Times, June 29, 2022.

Tanya Mohn, New York Times, June 29, 2022.

Tanya Mohn, New York Times, June 29, 2022.

Large-tired and tested: how Europe’s cargo bike roll-out is delivering, 18 August 2021.

Stakeholder’s Guide: Expanding the reach of cargo bikes in Europe, 2022.

10 Stakeholder’s Guide: Expanding the reach of cargo bikes in Europe, 2022.

11 Tanya Mohn, New York Times, June 29, 2022.

12 Tanya Mohn, New York Times, June 29, 2022.

13 5 Best Electric Cargo Vans for Professionals”, Merchants Fleet.

14 10 Best Electric Cargo Bikes for Families and Businesses in 2022,” BikeExchange, Sept 1, 2022.

15 10 Best Electric Cargo Bikes for Families and Businesses in 2022,” BikeExchange, Sept 1, 2022.

16 5 Best Electric Cargo Vans for Professionals”, Merchants Fleet.

17 How much do Tesla’s batteries weigh?”, The Motor Digest, Nov 27, 2021.

18 One example is the Bikes At Work lineup. I have used their 96” long trailer for about 15 years to haul lumber, slabs of granite, voluminous bags of compost and many other loads that would have been awkward or impossible to move with most cargo bikes.


Photo at top of page: “Eco-friendly delivery with DHL in London: a quadracycle in action,” by Deutsche Post DHL on flickr.com, Creative Commons 2.0 license.

The high cost of speed

Also published on Resilience

Imagine that we used a really crazy method to establish speed limits. We could start by recording the speeds of all drivers on a given stretch of roadway. Then, without any clear evidence of what a safe speed might be, we might argue that the great majority of people drive too fast, and therefore the maximum legal speed will be set as that speed exceeded by 85 percent of drivers. Only the slowest 15 percent of drivers, in this scenario, would be considered to be driving within the legal limit.

If you have a passing familiarity with the legal framework of car culture, you will recognize the above as a simple inversion of the common 85th percentile rule used by traffic engineers throughout North America. Following this guideline, driver speeds are recorded, engineers determine the speed exceeded by only 15 per cent of the drivers, and that speed is deemed an appropriate speed limit for the given roadway. All the other drivers – 85 per cent – will then be driving within the speed limit.

Two recent books argue that the 85th percentile guideline is as arbitrary and misguided as it sounds. In There Are No Accidents, (Simon & Schuster, 2022; reviewed here last week), Jessie Singer summarizes the 85th percentile rule this way:

“Most speed limits are not based on physics or crash test expertise but simply the upper limit of what most amateur drivers feel is safe. A speed limit is the perceived safe speed of a road, not the actual risk of traveling that speed on that road.” (Singer, page 95)

Singer draws on the work of Eric Dumbaugh, who has a PhD in civil engineering and teaches urban planning at Florida Atlantic University. Dumbaugh has analyzed tens of thousands of traffic crashes in urban environments in the US. He concluded that the traffic engineering guidelines used for decades are based on false information, are often misapplied, and result in dangerous conditions on urban roadways. Absent physical evidence of what constitutes a safe driving speed, engineers simply assume that most drivers drive at a safe speed. Dumbaugh doesn’t mince words:

“Traffic engineering is a fraud discipline. It presumes knowledge on road safety that it doesn’t have and it educates people generation after generation on information that is incorrect.” (quoted by Singer, page 96)

The dangerous conditions on roadways have contributed to thirty thousand or more deaths in the US every year since 1946. But the engineers who design the roadways cannot be faulted, so long as they have applied the rules passed down to them in standard traffic engineering manuals.

Confessions of a Recovering Engineer was published by Wiley in 2021.

Similar themes are also a major focus in an excellent book by Charles Marohn Jr., Confessions of a Recovering Engineer (Wiley, 2021). Marohn was trained as a civil engineer, and for the first part of his career he worked as a traffic engineer designing what he saw at the time as “improvements” to roadways in small cities. Over time he began to question the ideas he had absorbed in his education and the guidelines that he followed in his engineering practice.

Marohn is now founder and president of Strong Towns. He has emerged as one of the most vociferous critics of the planning principles underlying American suburbia, and the design guidelines used to justify the arterial roads in those suburbs. He writes,

“The injuries and deaths, the destruction of wealth and stagnating of neighborhoods, the unfathomable backlog of maintenance costs with which most American cities struggle, are all a byproduct of the values at the heart of traffic engineering.” (Marohn, page 5)

These values are held so widely and deeply, Marohn says, that they are seldom questioned or even acknowledged. These values include :

“• Faster speeds are better than slower speeds..
• Access to distant locations by automobile is more important than access to local destinations by walking or biking. …
• At intersections, minimizing delay for automobile traffic is more important than minimizing delay for people walking or biking.” (Marohn, page 12)

Working from his own experience as a traffic engineer, Marohn explains the order in which issues are considered when designing a new or “improved” roadway. First the engineer decides on a “design speed” – a driving speed which the road should facilitate. Next to be established is the traffic volume – all the traffic typically traveling the route at present, plus all the additional traffic the engineer anticipates in the future. At that point the engineer will choose a design based on official guidelines for that design speed and that traffic volume; so long as the guidelines are followed, the design will be deemed “safe”. Finally, the engineer will estimate how much it will cost.

Marohn argues that the questions of whether traffic should move slow or fast, and whether all existing traffic should be accommodated or instead should be restricted, are not technical issues – they are questions of values, questions of public policy. Therefore, he says, issues of the desired traffic speed and desired traffic volume should be dealt with through the democratic process, with public input and with the decisions made by elected officials, not by engineering staff.

Image courtesy of Pixabay.

Some sins are forgiven

In the early days of car culture, traffic casualties happened at a far higher rate per passenger mile than they do in recent decades. Part of the improvement is due to changes in vehicle design – padded surfaces, seat belts, air bags. Part of the improvement can be attributed to what is called “forgiving design”, at least as applied on rural highways. Examples of forgiving design are gradually sloped embankments, which reduce the likelihood of rollovers if a driver veers off the road; wider lanes which lessen the chance of sideswiping; centre barriers which prevent head-on collisions; straightening of curves to improve sightlines; and removal of roadside obstacles such as large trees which an errant driver might hit.

On highways these forgiving design principles make sense, Marohn believes, but on urban arterial roads they are disastrous. He coined the word “stroad” for urban routes that combine the traffic complexity of streets with the high design speeds of inter-city roads. Stroads feature the wide lanes, cleared sightlines and levelized topography of highways, giving drivers the impression that higher speeds are safe. But stroads also have many intersections, turning vehicles, and access points for pedestrians. This means that the higher speeds are not safe, even for the drivers. And vulnerable road users – pedestrians and cyclists – often pay with their lives.

Most stroads should be converted into streets, Marohn says. “Instead of providing drivers with an illusion of safety, designers should ensure the drivers on a street feel uncomfortable when traveling at speeds that are unsafe.” (Marohn, page 43) To ensure that the mistakes of pedestrians and cyclists, and not just drivers, are forgiven, he advocates these guidelines: “Instead of widening lanes, we narrow them. Instead of smoothing curves, we tighten them. Instead of providing clear zones, we create edge friction. Instead of a design speed, we establish a target maximum travel speed.” (Marohn, page 41)

On a typical urban street, with stores, offices, schools, restaurants, and many people moving around outside of cars, that target maximum speed should be low: “Traffic needs to flow at a neighborhood speed (15 mph [24 kph] or less is optimum) to make a human habitat that is safe and productive.” (Marohn, page 56)

In recent years there has been a substantial rise in pedestrian and cyclist fatalities, even as motorist fatalities have continued a long downward trend. The rising death toll among vulnerable road users was particularly noticeable during and following the pandemic. In Marohn’s words we find a good explanation:

“Most [traffic fatalities] happen at nonpeak times and in noncongested areas. … the traffic fatality rate is much higher during periods of low congestion. This is … because the transportation system is designed to be really dangerous, and traffic congestion, along with the slow speeds that result, is masking just how dangerous it is.” (Marohn, 117)

With many businesses closed and many people working from home, there was much less traffic congestion. And without congestion acting as a brake, people drove faster and more pedestrians were killed. That wasn’t intentional, but it was predictable – it was no accident.

* * *

As Jessie Singer explains, we find an extensive matrix of causes that contributes to “accidents” when we look beyond the individual making a mistake. That matrix very often includes racial and economic inequality, which is why poor people suffer more in nearly every accident category than rich people do.

Both racial and economic factors come into play in the current wave of pedestrian deaths. In the major city closest to me, Toronto, pedestrian deaths occur disproportionately among racialized, poor, and elderly people. These deaths also occur most often on wide arterial roads – stroads – in older suburbs.

Marohn’s words again are enlightening: “as auto-oriented suburbs age and decline … they are becoming home to an increasing number of poor families, including many who do not own automobiles.” (Marohn, page 43) When these residents need to walk across four, five or six lane high-speed arterial roads, the predictable result is pedestrian deaths among the most vulnerable. An obvious, though politically difficult, solution is to redesign these roads to bring speeds down to a safe level.

The inequality that contributes to “accidents” is buttressed in most North American cities by an elaborate legal framework telling people where they are allowed to live and work. That legal framework is zoning. In the next installment of this discussion we’ll look at the history and consequences of zoning.


Image at top of page is in public domain under Creative Commons CC0, from pxhere.